Related specifically to how much freight is moving, Cass Freight Index shipment volumes were only 1.8% below year-ago levels (Chart 1), significantly better than last month’s (7.6%) y/y change, and the best comp reported since November 2019. The raw index number rose 7% from August’s level to the highest reading since (also) November 2019. The shipment index is now 27.5% higher than the April lows, and we see it staying strong through year-end, as inventories remain relatively lean, and we expect freight to keep moving.
Chart 1 – The index is getting very close to even with year-ago levels, as demand recovery continues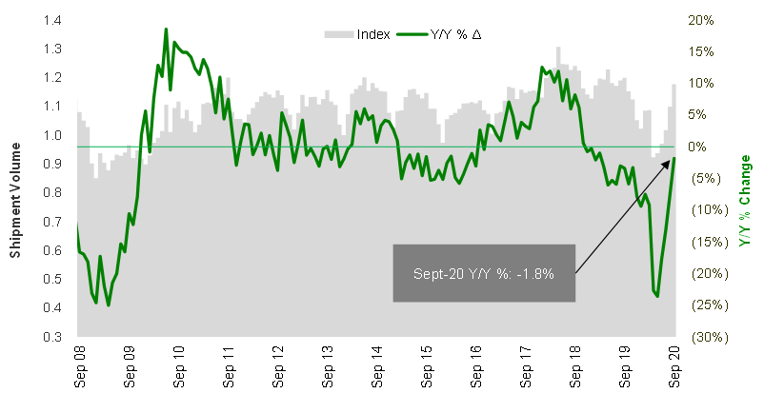
Source: Cass Information Systems, Inc and Stifel research
Click here to receive a monthly alert when new reports are released.
Consumer confidence, while still low (Chart 2), is seeing signs of life, which is encouraging. Maybe it’s due to optimism around the election, or optimism from businesses continuing to re-open, and/or optimism around healthcare advances, but if this continues, we expect it to be good for the Cass Index readings ahead.
Chart 2 – Consumer turning a corner?
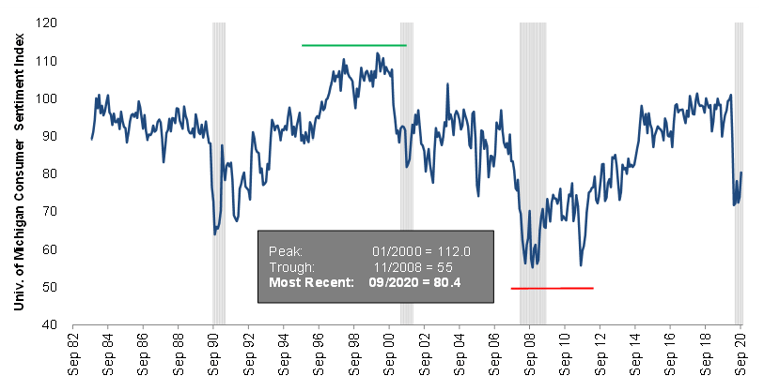
Source: University of Michigan
Looking at the international piece of the puzzle, imports are growing, which drives a lot of freight moving through the domestic system. Data for both the Ports of LA and Long Beach through August shows the surge in imports (Chart 3). The Port of LA just announced a 17% y/y increase in September import volume, so this trend likely continued to strengthen in September, as the Cass shipment data demonstrated. We have talked before about the “inventory dump” at the West Coast ports due to low inventory levels, where large U.S. importers are bringing in a disproportionate amount of their containers to southern California and then moving truck or rail around the U.S. to avoid stock-outs. This results in higher transportation costs, but it’s necessary to keep goods in stock (vs waiting for the longer transit time it takes for containers to get from Asia to the East Coast or Gulf Coast ports).
Air cargo remains tight, and there will be high rates through year-end due to (1) most commercial belly capacity staying out of the market until probably mid-to-late next year, and (2) an increase in consumer electronics product launches in Q4 2020 (such as the iPhone 12). Freighters have been operating for months near peak levels, so peak season ahead will be tight and yields high.
Chart 3 – Imports strong into U.S. West Coast ports
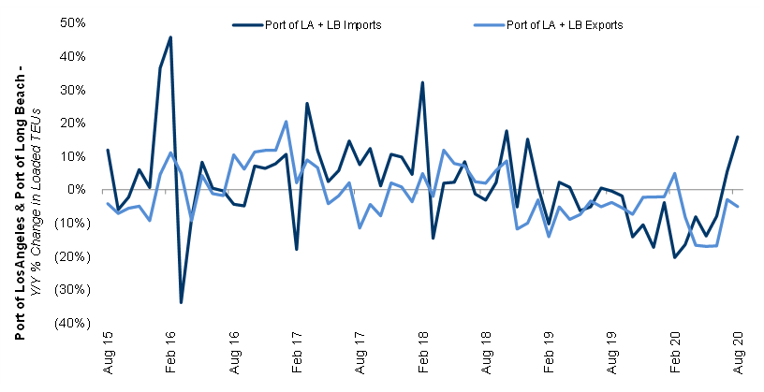
Source: Port of Los Angeles, Port of Long Beach
The weekly rail traffic data (Chart 4) showed further improvements through September and just posted positive y/y comps in October – both overall and excluding coal & grain. This data set tracks closely with the Cass Freight Index (Chart 5), so given that total rail carloadings have just turned positive here in October, we expect Cass Index trends may turn to y/y growth this month as well.
Chart 4 – Rail volumes turning positive y/y in October – Cass Index to follow?
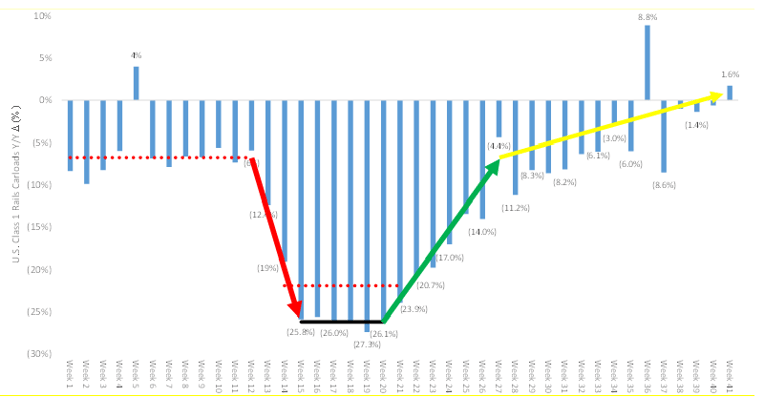
Note: Note – Week 41 carloads are originations through the week of 10/8/2020 for BNSF, CSX, KSU, NSC, and UNP
Source: Association of American Railroads and Stifel research
Chart 5 – Cass and rail volumes both show the “V”
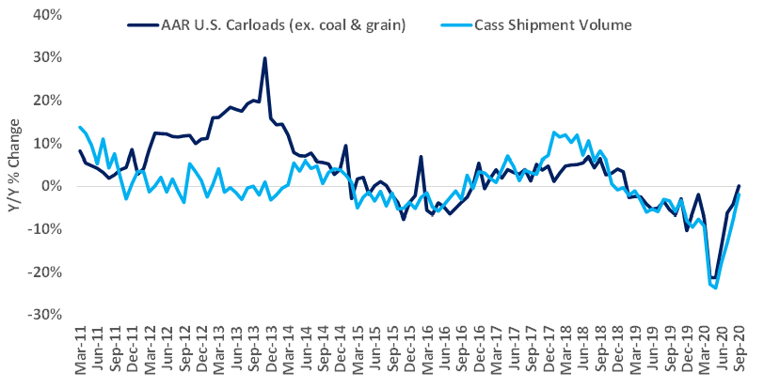
Source: Association of American Railroads, Cass Information Systems, and Stifel estimates
With respect to overall spend on transportation, the Cass Freight Index for expenditures increased 1.2% y/y in September (Chart 6) – 7% higher than last month, 29% better than May’s low, and the highest freight spend we’ve seen since June 2019 (and that’s with significantly less contribution this year from fuel surcharge revenue – Exhibit 7). As a reminder, the expenditures index measures the total amount spent on freight.
Chart 6 - Tight trucking market drives growth in total freight spend, even with lower fuel costs
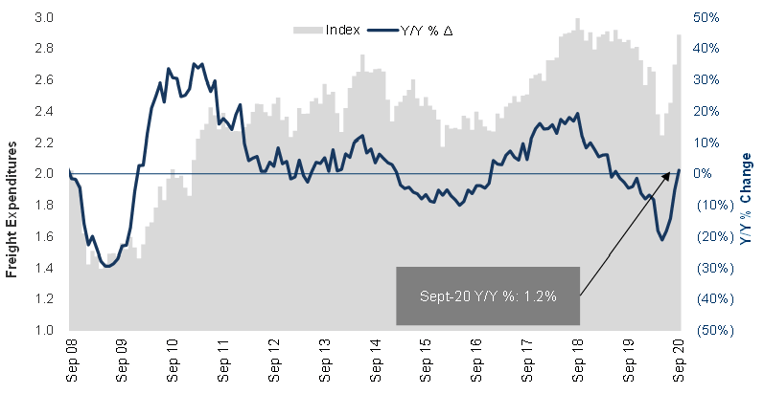
Source: Cass Information Systems, Inc. and Stifel research
Chart 7 – Diesel prices lower y/y, otherwise dollars/bill (yield) would be even higher
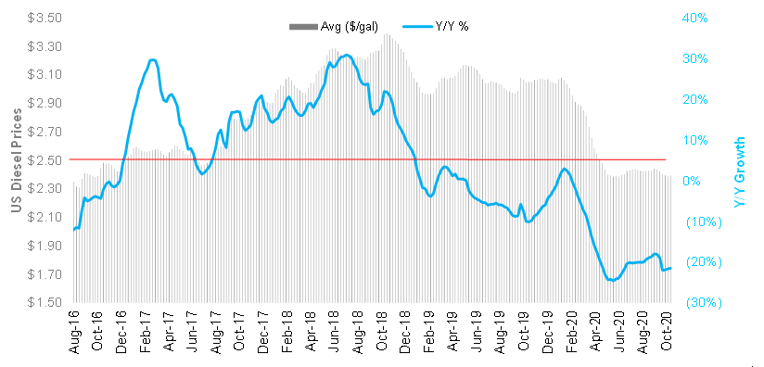
Source: Energy Information Administration
Cost per shipment (simply the expenditures index divided by shipments) is increasing (Exhibit 8) as trucking rates rise. There are real constraints on driver and industry supply and fewer trucks running (Exhibit 9), so as freight has rebounded, the capacity squeeze has driven rates up significantly. We don’t see much capacity entering or returning the rest of the year, so as supply/demand remains tight, we expect continued growth in the average freight bill..
Chart 8 - Cost per shipment moving higher, as capacity has tightened in the truckload market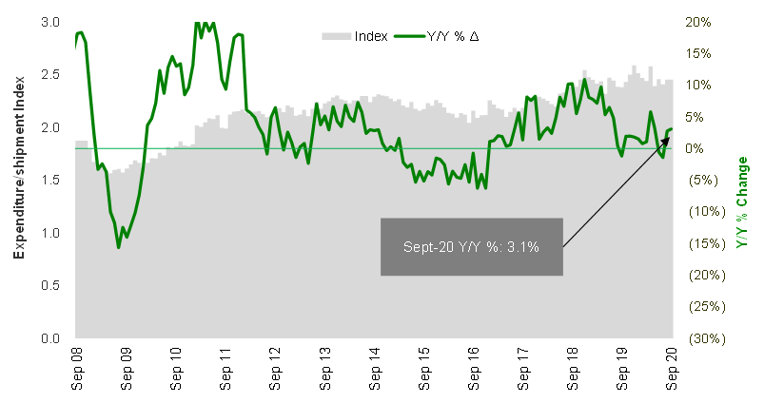
Source: Cass Information Systems and Stifel research
Chart 9 - Both large and small trucking fleets have shrunk in 2020
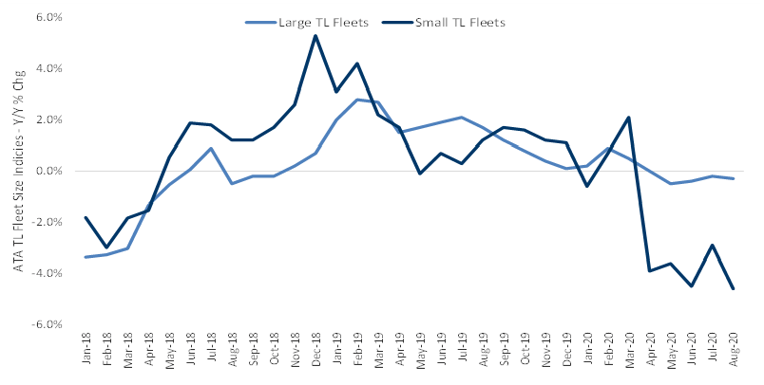
Source: American Trucking Associations and Stifel research
The Truckload Linehaul Index (Chart 10), measuring per-mile linehaul rates, takes a look at the largest (and most fragmented) market in the domestic transportation landscape. This index declined 3.4% y/y in September. Still, this was the highest reading since December 2019, indicating a turn in truckload pricing. We believe it is not higher only because it’s mostly tied to contract rates and not the faster-moving spot market. As contract rates are repriced over the coming quarters, this will play catch-up and turn to y/y growth.
The combination of rising and healthy demand with limited supply is causing shippers to pay more to get their freight moved, as “turn-downs” by carriers are still at very high levels. This is evident from the spot rates posted in through early October (Chart 11). Spot rates are tracking much higher y/y (including fuel surcharges) in the dry van, flatbed, and reefer markets, with dry van now above 2018 peak levels.
Chart 10 – Truckload Linehaul Index continues to increase
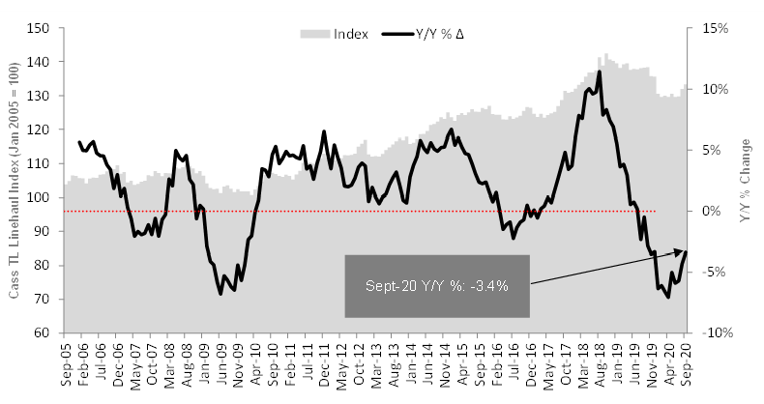
Source: Cass Information Systems, Inc. and Stifel research
Chart 11 – All truckload spot rates near, at, or above high 2018 levels
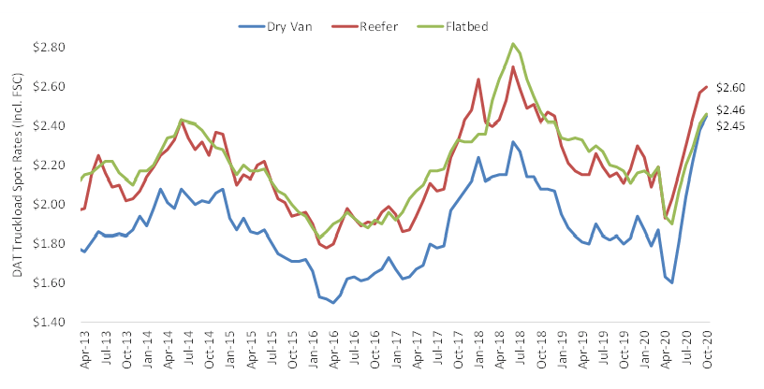
Source: DAT Solutions, through week ended 10/11/20
We note the Cass Truckload Linehaul Index (Chart 12) has a strong correlation to the quarterly yield metrics reported by the publicly traded TL carriers.
Chart 12 – Cass Truckload Linehaul index shows a turn underway into Q4 with public carrier rates
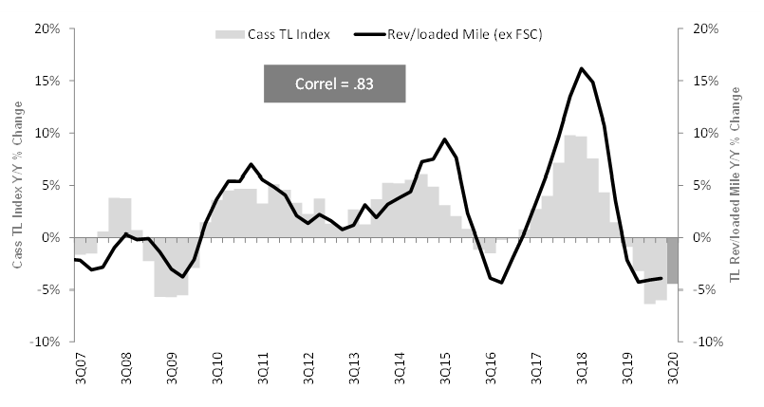
Source: Cass Information Systems, Inc., public carrier data, and Stifel research
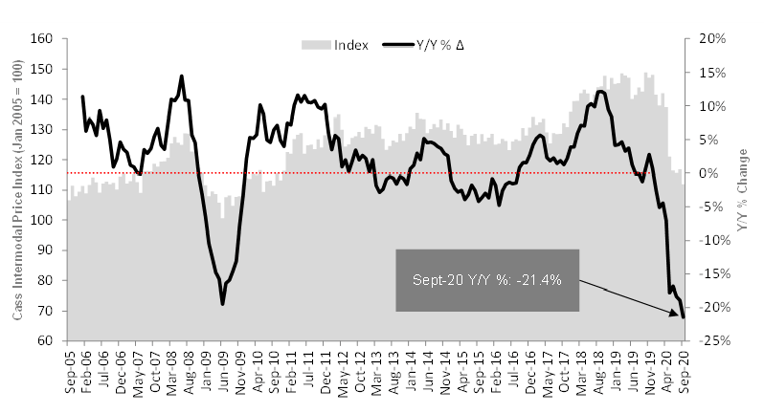
The Cass Intermodal Price Index (Chart 13), measuring total per-mile costs, looks at the smaller intermodal market and shows much worse trends than TL, falling to a new low of (21.4%) y/y in September (and down 4% sequentially from August – not due to fuel). This is the lowest absolute reading since September 2010. There are two main drivers of this – 1) the fuel surcharge – while the Cass Truckload Linehaul Index excludes fuel surcharge, the intermodal index includes fuel surcharges, and 2) intermodal pricing has been on a lag vs TL pricing, so as intermodal demand improves further (Chart 14) and TL contract rates move higher, intermodal rate increases should follow.
Chart 13 – Cass Intermodal Price Index off big vs 2019 due to lower fuel + lag vs TL rates
Source: Cass Information Systems, Inc., public carrier data, and Stifel research
Chart 14 – Intermodal is growing, and with truck rates higher, expect intermodal pricing to turn soon
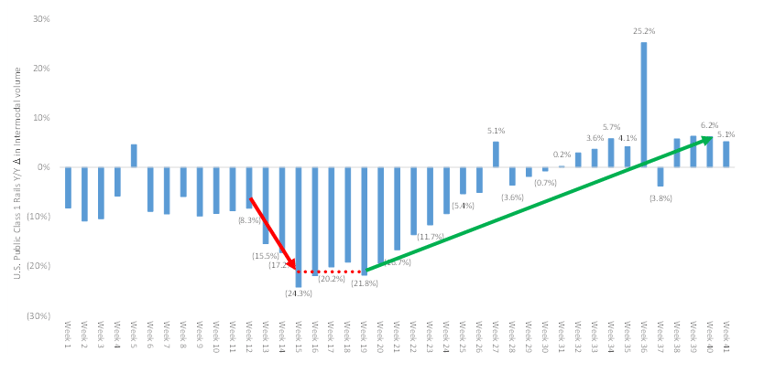
Note – Week 41 carloads are originations through the week of 10/8/2020 for BNSF, CSX, KSU, NSC, and UNP
Source: AAR
In summary, the Cass Freight Index showed a big step up in September, in both shipping volumes and overall spending. We expect the rising price environment to continue through year-end and into 2021, as contract pricing in both TL and intermodal are reset higher. Demand should be strong at least into Q1 2021 due to inventory restocking, so we believe we’ll see positive y/y shipment growth in Q4 of this year.