Cass Transportation Index Report November 2025

Get the most up-to-date data and insights into shipping volumes and the cost of freight. See how they change each month and understand the market forces behind them.

SubscribeDownload Historical Data Points (xls)

Hunkering Down 

  November 2025 Year-over-year change 2-year stacked change Month-to-month change Month-to-month change (SA*)
Cass Freight Index - Shipments 1.004 -7.6% -8.2% 0.7% 2.7%
Cass Freight Index - Expenditures 3.163 -1.2% -5.0% -0.2% 2.1%
Truckload Linehaul Index 142.2 2.2% 1.1% 0.1% NA


* SA = seasonally adjusted

Cass Freight Index® - Shipments

  • The shipments component of the Cass Freight Index rose 0.7% m/m in November, or 2.7% m/m in seasonally adjusted (SA) terms, reversing the 2.1% SA drop in October.
  • The y/y decline in shipments of 7.6% in October was below the -5.8% YTD trend, putting the index on track for a ~6% decline in 2025.

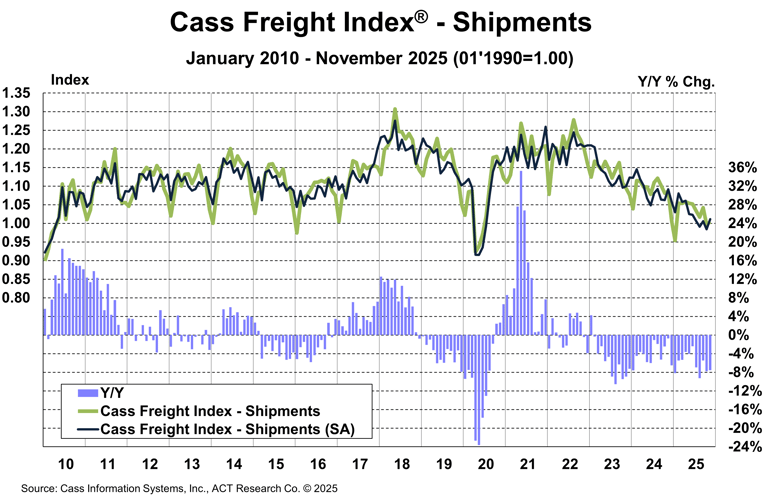
After truckload volumes briefly improved in Q3 ahead of the October 5 import tariff deadline, they have softened again so far in Q4 as pre-tariff stocks are drawn down.

Resilient early holiday consumer spending data suggest some pent-up demand could be building, but tariffs are likely to continue to press prices higher and affordability lower in 2026.

  • In December, the shipments component of the Cass Freight Index would decline 4% y/y on the normal seasonal pattern.


Cass Freight Index Shipments November 2025


See the Methodology for the Cass Freight Index


Cass Freight Index - Expenditures

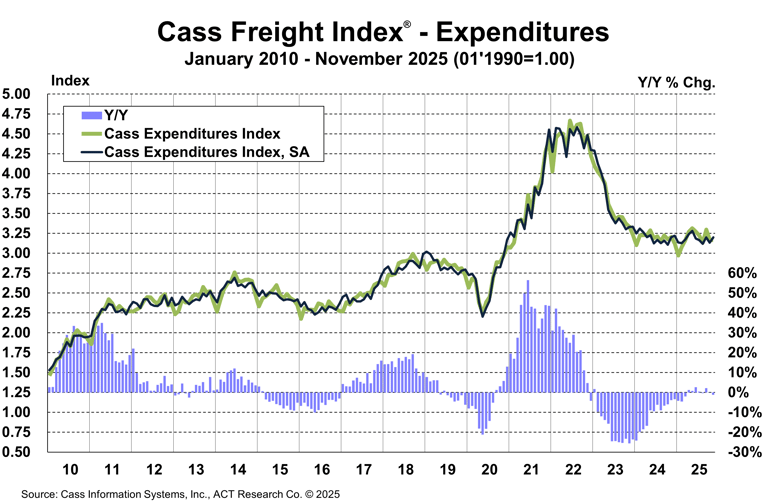
The expenditures component of the Cass Freight Index, which measures the total amount spent on freight, fell 0.2% m/m in November. Expenditures were 1.2% below the year-ago level in November, after a 0.2% y/y slip in October.

The flattish results of the past few months were a combination of lower shipments and higher rates. We infer rates rose 6.8% y/y, largely due to changing modal mix with more TL and less LTL, similar to recent months.

  • In SA terms, the index rose 2.1% m/m, below the 2.7% gain in shipments, with rates implied down slightly.

The expenditures component of the Cass Freight Index, after a record 38% surge in 2021 and another 23% increase in 2022, fell 19% in 2023 and 11% in 2024. In 2025, the index is likely to decline by under 1%, and it could end up flat with a strong December.


Cass Freight Index Expenditures November 2025


Download the Data

Truckload Linehaul Index

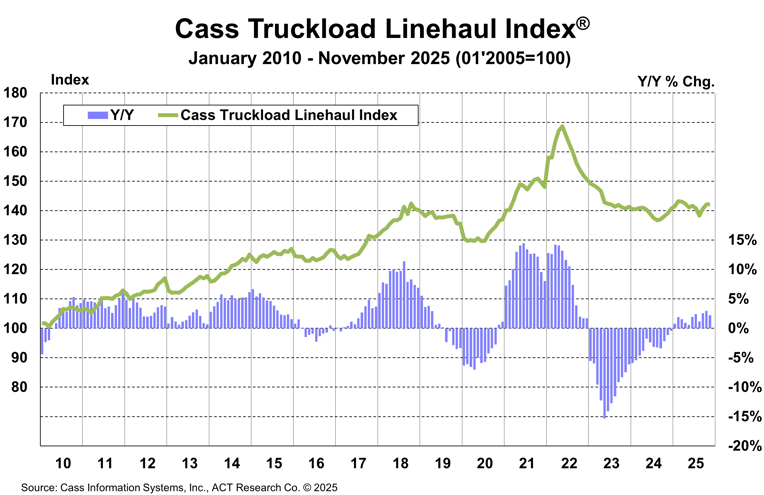
The Cass Truckload Linehaul Index rose 0.1% m/m in November, after a 1.1% increase in October.

  • The y/y increase decelerated to 2.2% in November, from 3.0% in October.
  • As holiday spending surpasses low expectations and weather adds to capacity constraints amid the holidays, the market balance is briefly tipping toward fleets in December.

This index fell 10% in 2023, another 3.4% in 2024, and we estimate a 1.7% increase in 2025.


Cass Truckload Linehaul Index November 2025


See the Methodology for the Cass Truckload Linehaul Index


Freight Expectations

Frigid December weather, featuring three storms so far, is consistent with the La Nina weather pattern that could continue to bring more storms across the northern U.S. and Canada, while likely leaving the South drier. This is pinching spot capacity pretty hard during one of the seasonally strongest periods of the year for demand, sending spot rates up in recent weeks.

Though not necessarily sustainable, as weather effects are typically brief, the stormy winter combines with tightening capacity and contributes to the eventual cycle turn. This moves the freight rate outlook up in the near term.

On the other hand, news from the Environmental Protection Agency (EPA) via the American Truck Associations (ATA) in the past month informed the industry that EPA’27 low-NOx regulations will partially go into effect in 2027. In a nutshell, the technology improvements stay, but the costly warranty and useful life extensions are jettisoned. Official word from the EPA is still a few months away.

Investment dollars are scarce amid generationally low for-hire truckload profit margins, but this provides new motivation to prebuy in 2026, for those who have the means. A large prebuy isn’t likely, since private fleets, who have the means, are still managing down excess capacity from overbuying in 2023-2024. Still, this provides a degree of moderation for the 2026 rate outlook.

---


Forecasts through 2027 are detailed in the ACT Research Freight Forecast. This service provides in-depth analysis and forecasts for a broad range of U.S. freight measures, including the Cass Freight Index, Cass Truckload Linehaul Index, DAT spot and contract rates by trailer type, LTL, and intermodal price indexes. The monthly report provides monthly, quarterly, and annual predictions for over forty data series over a two- to three-year time horizon, including capacity, volumes, and rates. The ACT Research Freight Forecast is released monthly in conjunction with the Cass Transportation Index report.

How have ACT Research’s freight forecasts performed? Their 2024 forecasts for the Cass Truckload Linehaul Index were 98.8% accurate on average from 18 months out. The Cass Truckload Linehaul Index averaged 139.3 in 2024, precisely in line with our December 2023 estimate. 

(As a reminder, ACT Research’s Tim Denoyer writes this report.)


ACT Forecast Accuracy Cass TL LH Index 2024x


For 2024, ACT’s forecasts for the shipments component of the Cass Freight Index were 95.0% accurate on average for the 18-month forecast period.


ACT Forecast Accuracy Cass Shipments Index 2024x


Release date: We strive to release our indexes on the 13th of each month. When this falls on a Friday or weekend, our goal is to publish on the next business day.

Tim Denoyer head

About the Author: Tim Denoyer, ACT Research

Tim Denoyer joined ACT Research in 2017 after spending fifteen years in equity research focused primarily on the transportation, machinery, and automotive industries. Tim is a senior analyst leading ACT’s transportation research effort and the primary author of the ACT Freight Forecast, U.S. Rate and Volume OUTLOOK. Research associate, Carter Vieth, who joined ACT in early 2020 after graduating from Indiana University, also contributes to the report. This report provides supply-chain professionals with better visibility on the future of pricing and volume in trucking, the core of the $1.2 trillion US freight transportation industry, including TL, LTL, and intermodal. 

Tim also contributes to ACT’s core Classes 4-8 commercial vehicle (CV) data analysis and forecasting; powertrain development, such as electrification analysis; and used truck valuation and forecasting. Tim has supported or led numerous project-based market studies on behalf of clients in his six years with ACT on topics ranging from upcoming emissions and environmental regulations to alternative powertrain cost analyses, to e-commerce and last-mile logistics, to autonomous freight market sizing.  

ACT’s freight research service leverages its expertise in the supply-side economics of transportation and draws upon Tim’s background as an investment analyst, beginning at Prudential and Bear Stearns. Tim was a co-founder of Wolfe Research, one of the leading equity research firms in the investment industry. His experience also includes responsibility for covering the industrial sector of the global equity markets, including with leading investment management company Balyasny Asset Management.

Disclaimer

The material contained herein is intended as general industry commentary. The Cass Freight Index, Cass Truckload Linehaul Index (“Indexes”), and other content are based upon information that we consider reliable, but Cass does not guarantee the accuracy, timeliness, reliability, continued availability or completeness of any information or underlying assumptions, and Cass shall have no liability for any errors, omissions or interruptions. Any data on past performance contained in the Indexes is no guarantee as to future performance. The Indexes and other content are not intended to predict actual results, and no assurances are given with respect thereto. Cass makes no warranty, express or implied. Opinions expressed herein as to the Indexes are those of ACT Research and may differ from those of Cass Information Systems Inc. All opinions and estimates are given as of the date hereof and are subject to change.

Receive Index updates straight to your inbox