The shipments component of the Cass Freight Index fell 7.1% y/y and 4.9% m/m in January, or 2.0% m/m in seasonally adjusted (SA) terms, reaching a new cycle low.
The normal seasonal trend would have the shipmentscomponent of the Cass Freight Index down 11% y/y in February, although arebound from the weather could support volumes above this.
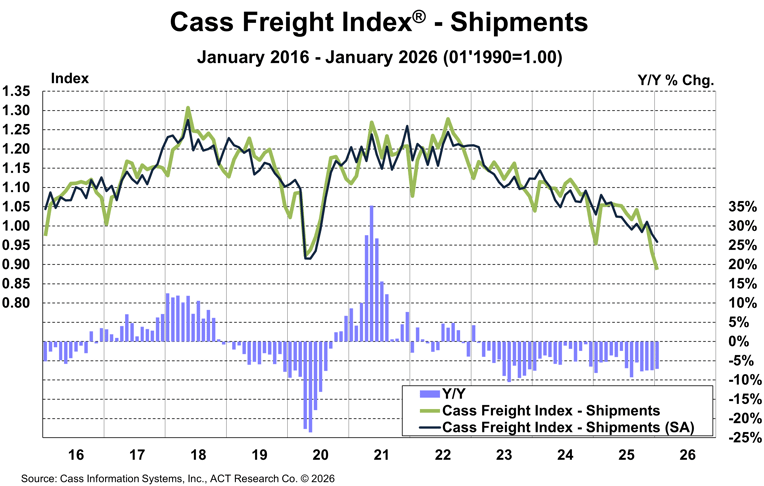
See the Methodology for the Cass Freight Index
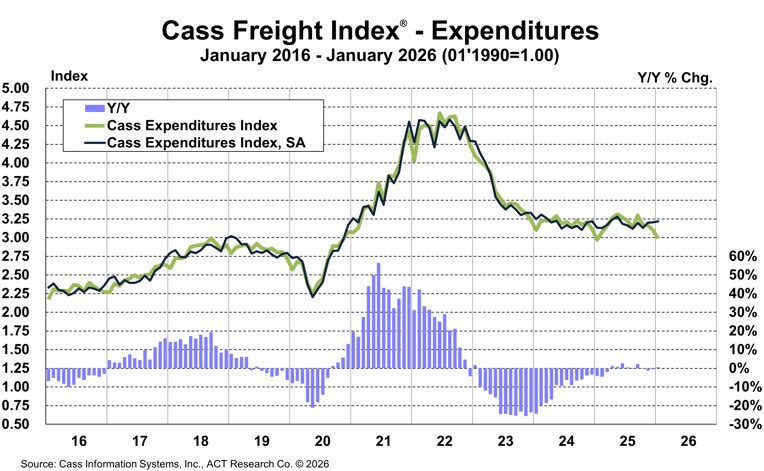
The expenditures component of the Cass Freight Index, which measures the total amount spent on freight, fell 3.6% m/m in January. Expenditures were up 0.6% from the year-ago level in January, after a 0.6% y/y dip in December.
The flattish results of the past few months were a combination of lower shipments and higher rates. With shipments down considerably, we can conclude higher freight costs.
In SA terms, the index rose 0.4% m/m, after a 0.2% m/m increase in December.
The expenditures component of the Cass Freight Index, after a record 38% surge in 2021 and another 23% increase in 2022, fell 19% in 2023 and 11% in 2024. In 2025, the index declined by 0.5%.
The Cass Truckload Linehaul Index rose 1.7% m/m in January, after a 1.0% increase in December.
Rates rose 3.2% y/y as weather challenged volumes. Warmer weather should lead to some trend reversion, but for February at least, spot rates are likely to accelerate.
This index is mostly comprised of contract rates, and anecdotally we hear about more shippers initiating one-year bids, suggesting movement in the cycle beyond just weather effects.
This index reflects the whole for-hire market, both spot and contract rates.
This index fell 10% in 2023, another 3.4% in 2024, and turned up to a 1.8% increase in 2025.
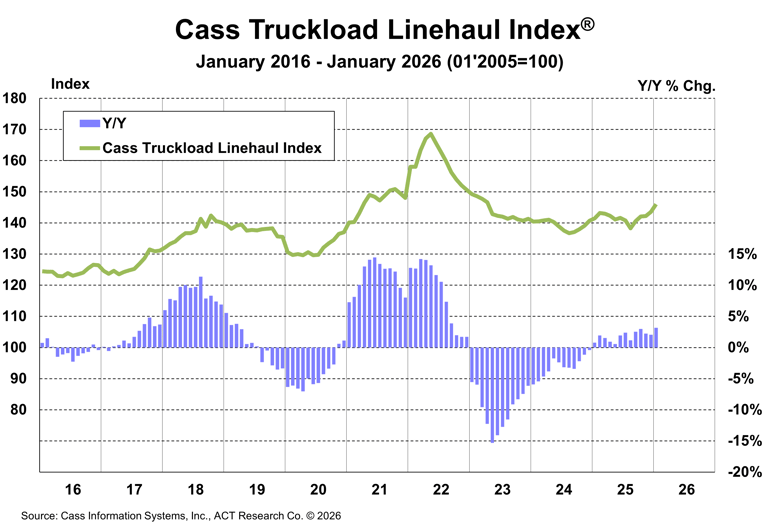
See the Methodology for the Cass Truckload Linehaul Index
After a winter heavy with severe weather, the current forecast for most of the U.S. includes record warmth, so a considerable driver of higher truckload rates is reversing. However, capacity is also contracting in terms of equipment, drivers, and operating authorities. While the post-pandemic private fleet expansion continues to keep it from the for-hire market, U.S. freight demand is growing.
The freight economy continues to grow, and the for-hire recovery will begin when private fleet capacity, which has been in contraction since 2025, becomes tight. This did just happen, in fact, but the real test will be during softer seasonal periods like March and April.
Fleets are getting excited that the long-awaited recovery is here. Even 2% contract rate increases are a relief after four years of nothing or worse. While near-term reversion from the weather may slow the trend, we expect tighter capacity to lead to moderate truckload rate increases in 2026.
Forecasts through 2027 are detailed in the ACT Research Freight Forecast. This service provides in-depth analysis and forecasts for a broad range of U.S. freight measures, including the Cass Freight Index, Cass Truckload Linehaul Index, DAT spot and contract rates by trailer type, LTL, and intermodal price indexes. We provide monthly, quarterly, and annual predictions for over forty data series over a two- to three-year time horizon, including capacity, volumes, and rates. The ACT Research Freight Forecast is released monthly in conjunction with the Cass Transportation Index report.
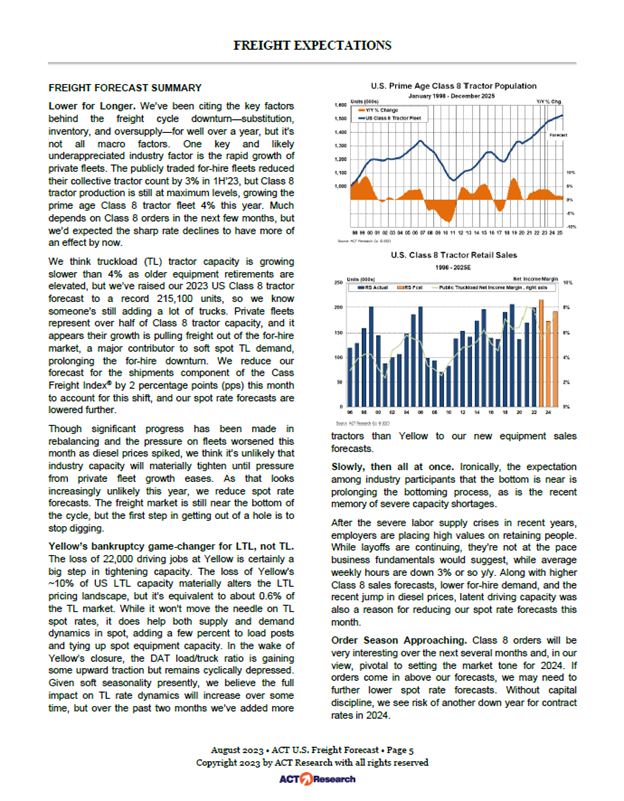
How have the freight forecasts performed?
The ACT Research Freight Forecast now predicts 74 distinct data series covering TL, LTL, and intermodal volumes and rates, and we’re adding more. Rather than another chart comparing forecasts to actuals, this one-page monthly summary, from 2.5 years ago, may be worth reading if you want to understand why our supply-side perspective is helpful for planning, strategy, and forecasting. But be warned, most of these trends have played out and are reversing.
(As a reminder, ACT Research’s Tim Denoyer writes this report.)
Release date: We strive to release our indexes on the 13th of each month. When this falls on a Friday or weekend, our goal is to publish on the next business day.

