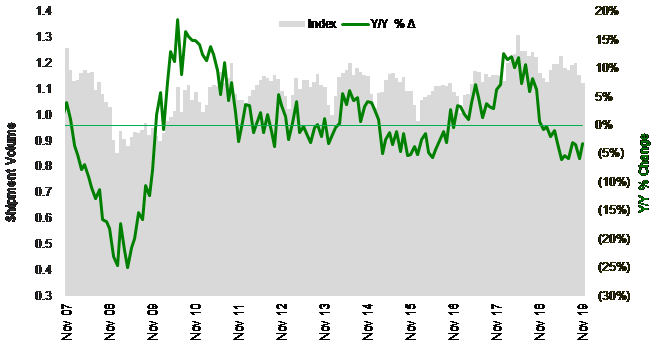
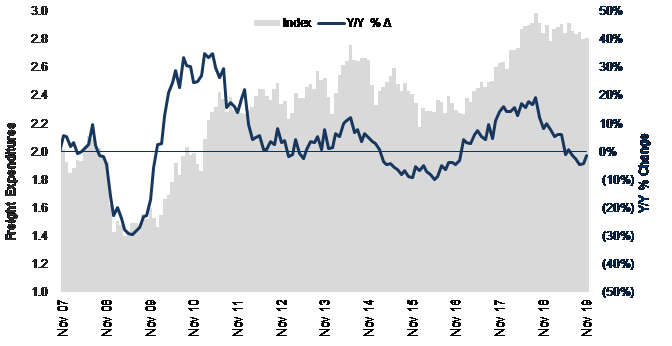
Both the shipments and expenditures components of the Cass Freight Index remain down from their peaks in May and September of 2018, respectively, but both appear to be getting “less bad” with y/y comps not off as much as we saw in October. Over the coming months, expect y/y growth to flatten out, as the industrial economy is expected to bottom, while the consumer remains relatively healthy.
Shipment volumes, which have been negative y/y all year, fell 3.3% y/y in November. We’ve been talking for several quarters now about how we’re in another freight recession (the other being 2015-2016) during this long-tenured economic expansion in the U.S., which shows most clearly in the rail carload, LTL tonnage, and Cass shipment data. Some of this is due to an inventory destock (primarily at the retail level), while much is due to the softening industrial economy (where we believe inventories are still elevated). Moving into 2020, we expect volumes to flatten out but not surge much, and a turn to positive y/y comps in the shipments index could be seen as soon as January 2020.
To activate the data download feature, double click within the chart area and then select the download icon.
Click here to receive a monthly alert when new data is released.
Freight expenditures (i.e., the total dollars spent on freight), dropped 1.4% vs year-ago levels. Although spending is down, the fact that shipments dropped more than spending implies that pricing remains above late 2018 levels. The fact that average spend per unit is up may sound strange, given the sharp drop in spot truckload rates in 2019 vs 2018, but most shippers move freight through the contract market, which necessarily lags any big changes in supply/demand. Therefore, many contracts that were repriced in 2018 still carried into and through much of 2019. Since the Cass Freight Index is a mix of freight modes (but >50% truckload), the outperformance of expenditures vs volumes reflects not only the aforementioned lag effect but also the better pricing power exhibited by the rail, intermodal, parcel, and LTL sectors. We expect transport pricing growth to moderate in 2020 but remain inflationary, so our forecast is for freight expenditures to modestly outpace a generally flattish volume environment.
To activate the data download feature, double click within the chart area and then select the download icon.
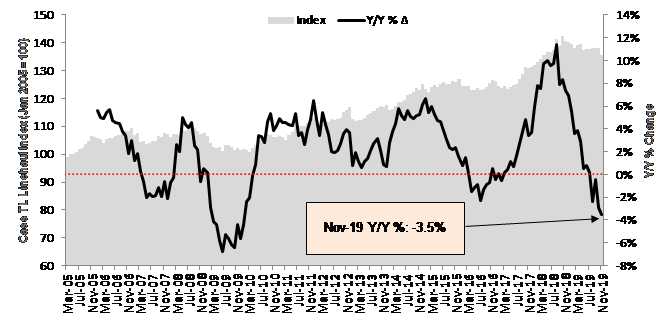
The Truckload (TL) Linehaul Index takes a more focused look at the largest market in the domestic transportation landscape, and it showed rates continuing to decelerate in November. The index was 3.5% lower than November 2018, and we believe we have a couple more quarters of downward rate pressure ahead due to soft demand and excess supply. The big wild card is the capacity situation and how that may unfold in the first half of 2020 with some regulatory changes (AOBR to ELD conversion this week) and then the Drug & Alcohol Clearinghouse (1/6/20), plus rising pressure on insurance costs. Assuming no significant tightening from these factors, TL rates should remain fairly stable in 2020.

To activate the data download feature, double click within the chart area and then select the download icon.
Furthermore, we show in the graph below that the Cass TL Linehaul Index has a strong correlation to the quarterly yield metrics reported by the publicly traded TL carriers. This index should be watched intra-quarter to see any changes to trends that may impact the stocks. Presently, going off this data and from conversations we’ve had with several carriers this past week, we see 4Q19 as a soft quarter for both pricing and volumes among trucking companies.
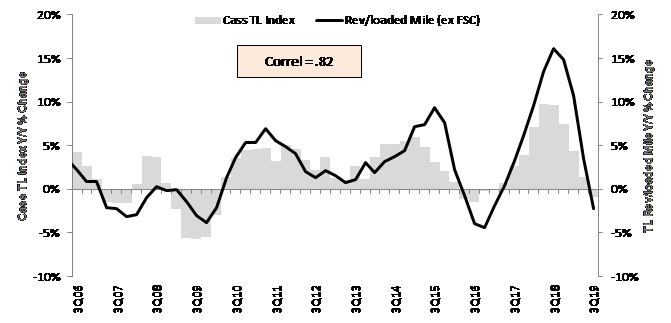
Source: Cass Information Systems and public carrier data
Note: All historical truckload and intermodal data was restated in November 2019, with an extremely high correlation to the previous data.
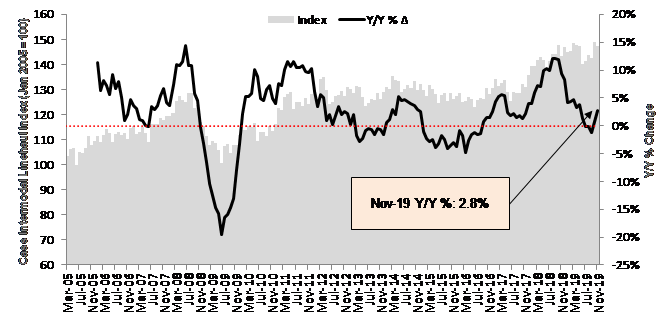
The Cass Intermodal Price Index zeroes in on a much smaller market and shows that rates are back on the rise, up 2.8% year over year in November. This will be even stronger when TL rates begin improving again, as truckload pricing is weighing some on intermodal pricing (but even more on intermodal volumes). The intermodal providers have done a nice job maintaining price discipline, and the improved rail service should allow for continued rate increases.

To activate the data download feature, double click within the chart area and then select the download icon.
Note: All historical truckload and intermodal data was restated in November 2019, with an extremely high correlation to the previous data.