Shipment volumes dropped 9.2% vs March 2019 levels (Chart 1), but the index improved sequentially for the second straight month off the January bottom. April will undoubtedly be worse and likely the worst month in a long time. There has been a clear divide between winners and losers of these shut-in orders with demand for groceries, home improvement, e-commerce, and consumer staples increasing, while restaurant, auto, and (mall) retail falling to practically zero volume.
Chart 1 – Cass Freight Index – Shipment Volumes. March slid back down on the comp, and April should rival early 2009
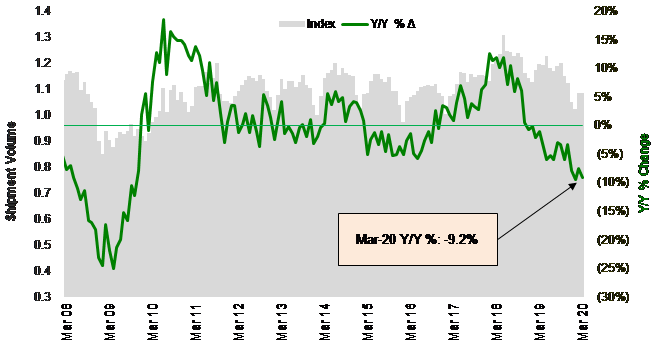
Source: Cass Information Systems and Stifel research
To activate the data download feature, double click within the chart area and then select the download icon.
Click here to receive a monthly alert when new data is released.
We spoke about consumer confidence last month being seriously at risk, given the media blitz, school closings, event cancellations, corporate travel bans, and the fear dominos falling around the coronavirus. It has faded, and how could it not? Just look at the remarkable spike in unemployment claims (Chart 2) in recent weeks. We’ve never seen anything like it. Therefore, it’s also hard to predict exactly what it will mean as we move through the year.
Chart 2 – U.S. Unemployment Claims. Biggest spike on record – and that’s with some states having bottlenecks around claim filings
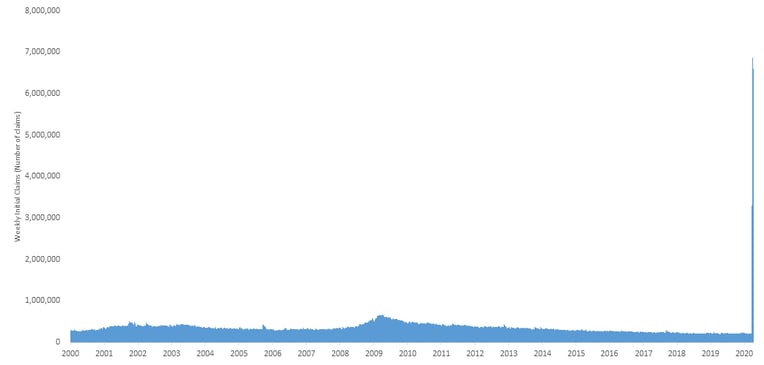
Source: Department of Labor
One indicator we track and believe is important to watch regarding freight demand is inventory levels, but the latest data is too old to be meaningful given the current environment. Some shippers have inventory filling up warehouses, others have it sitting in ocean containers not even being unloaded, and still others have near empty warehouses, because they can’t keep any inventory due to the high demand that causes freight to flow through the system as soon as it’s produced. Coming out of the period, some will need to restock, and some will need to destock. Where that balances out is hard to tell.
It also turns out that—given the consumer was chopped down at the knees over the past month— manufacturers in China don’t really have to play catch-up. Idle container ships are stacking up in the Pacific, as ocean volumes slow. But the airfreight market is still tight due to lack of passenger belly space (more commercial flights have been cancelled since just a few weeks ago), although some passenger carriers are literally placing cargo in the main cabin around seats and not just below deck to try and earn some money from their assets that would otherwise be grounded.
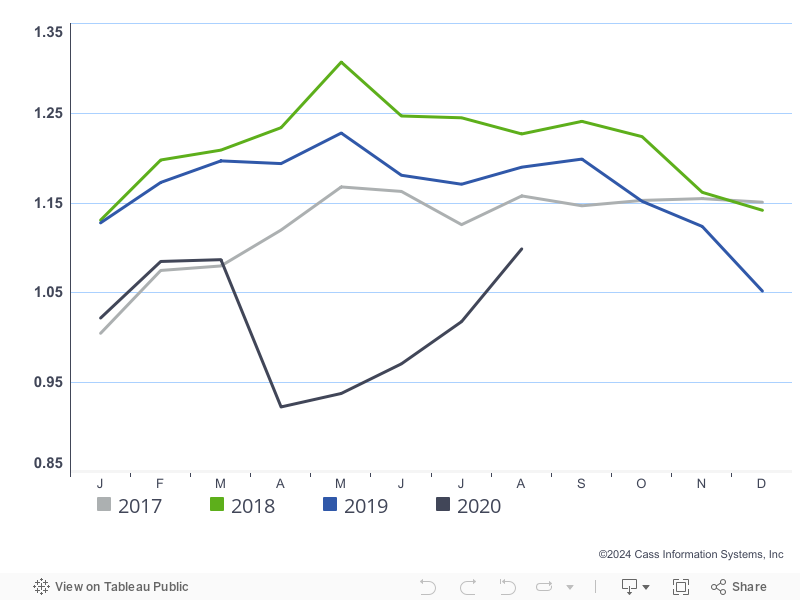
Railroad volume data (Chart 3) typically tracks similar to the Cass Shipments Index, and YTD, it’s showing what may be ahead for domestic freight movements, given the fall-off the last two weeks. Of course, the Cass Freight Index is much more focused on truck than rail, which is why we show the carloadings below without coal and grain shipments, which tends to track closer to truck activity. While shipment volumes should trough in April due to the coronavirus crisis, we expect a rebound in weekly volumes later in 2Q20 to signal a climb back toward more normal economic activity.
Chart 3 – U.S. rail volume comps significantly worsened at the end of March and into April
Note - Carloads are originations through the week of 4/4/2020
Source: Association of American Railroads and Stifel research
Cass Freight Index - Expenditures
Back to the Cass Index, freight expenditures, like shipment volumes, also fell in March, down 8.2% y/y (Chart 4). The gap between volume and spending comps continues to close, as pricing has been adjusted lower in the truckload market. We expect transport pricing growth to stay soft this month and next, but we’re watching capacity exits and a potential re-stocking event to drive rates higher again later this year.
Chart 4 – Total freight expenditures drop back to levels of the last freight recession
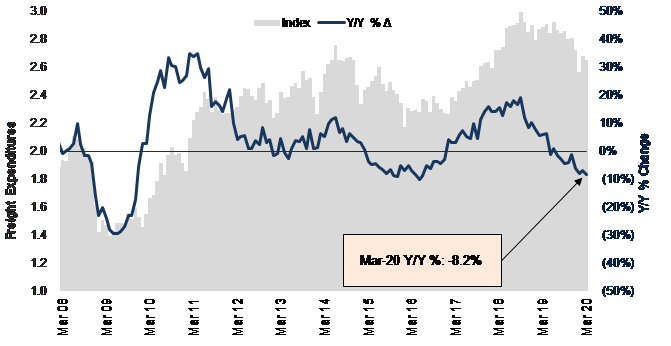
Source: Cass Information Systems, Inc. and Stifel research
To activate the data download feature, double click within the chart area and then select the download icon.
The Cass Truckload Linehaul Index (Chart 5), measuring per-mile linehaul rates, takes a look at the largest (and most fragmented) market in the domestic transportation landscape. Linehaul rates declined 6.6% y/y in March (the worst comp reported since June 2009), as rates remained under pressure through the end of the seasonally soft first quarter.
Supply and demand are the ultimate drivers of truckload rates, and while the truckers were deemed essential and have been critical to keeping the shelves stocked at local grocery and convenience stores through this odd period of time, they are not immune to being hurt by everything going on. It has been very customer-dependent, where carriers with exposures to business still allowed to be open have been doing well. In contrast, those with concentrations of freight that aren’t moving right now have had to go to the broker market and get what they can. This broad pricing pressure should last a little longer, but then when the economy re-opens (and it will), we’ll see how many truckers are left and how much freight needs to be moved.
Chart 5 – Truckload Linehaul Rates. The Cass Truckload Linehaul Index falls further – back to global financial crisis levels
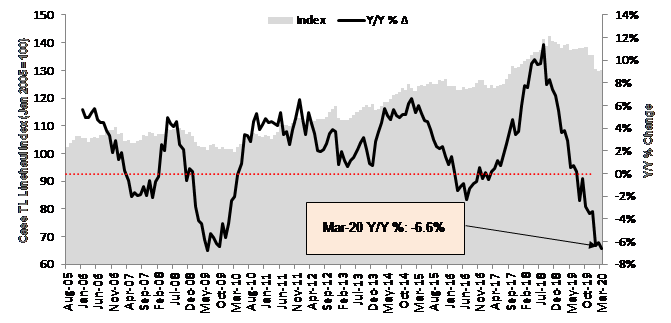
Source: Cass Information Systems, Inc. and Stifel research

To activate the data download feature, double click within the chart area and then select the download icon.
As we’ve shown (Chart 6) the Cass Truckload Linehaul Index has a strong correlation to the quarterly yield metrics reported by the publicly traded TL carriers. The fact that January-March rates were so soft looks like another tough 1Q20 earnings season for publicly traded truckload companies. Their reports begin this week.
Chart 6 – Cass Truckload Linehaul index indicates public carrier yields to remain weak in 1Q20
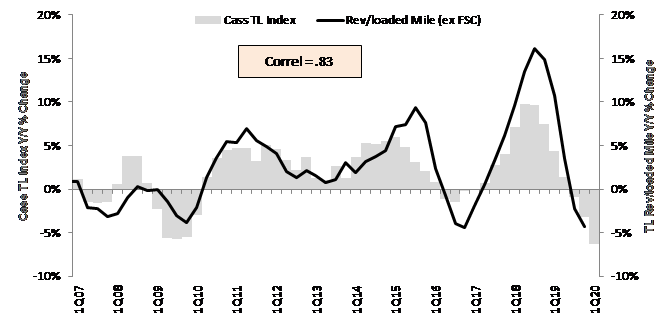
Source: Cass Information Systems, public carrier data, and Stifel research
Note: All historical truckload and intermodal data was restated in November 2019, with an extremely high correlation to the previous data.
Spot rates (Chart 7) rebounded in March with the consumer panic buying, but then dropped back off last week. We expect the spot market to be subdued until businesses reopen, at which point we could see a spike, depending on how quickly things go “back to normal.”
Chart 7 – TL spot rates rose again in March before falling back in the most recent week
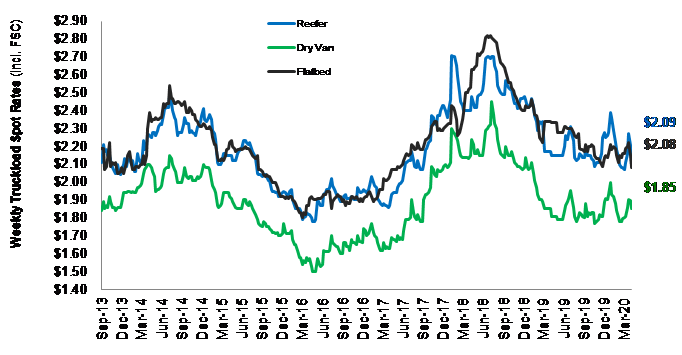
Source: DAT Solutions, through week ended 4/4/20
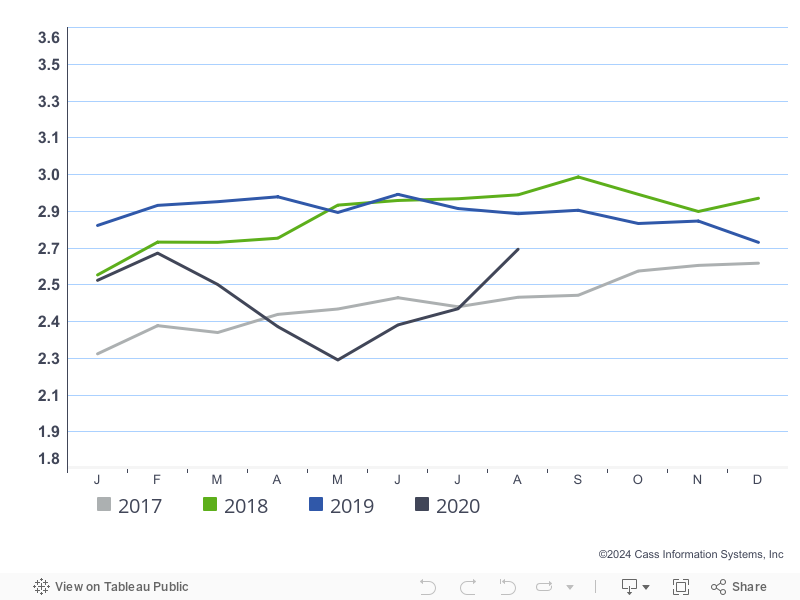
The Cass Intermodal Price Index (Chart 8), measuring total per-mile costs, looks at the smaller intermodal market and shows some trend improvement, down just 4.4% y/y in March (after dropping 5.1% y/y in February). But we wouldn’t call it a bottom, given what’s going on with volumes as we enter April (Chart 9). At some point, we believe intermodal rates should strengthen again when TL rates begin improving, but intermodal pricing has held in better than some may have expected to date.
Chart 8 – The Cass Intermodal Price Index took a step down to start 2020
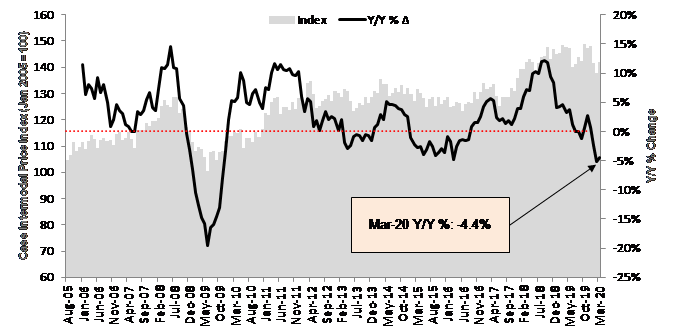
Source: Cass Information Systems, Inc. and Stifel research
Chart 9 – Intermodal volumes took a big step down the last week of March and first week of April
Source: Association of American Railroads

To activate the data download feature, double click within the chart area and then select the download icon.
Note: All historical truckload and intermodal data was restated in November 2019, with an extremely high correlation to the previous data.
We hope the Cass Indexes bottom in April, and the quicker businesses can reopen, the better readings we should see in May and June.