Cass Transportation Index Report February 2024

Get the most up-to-date data and insights into shipping volumes and the cost of freight. See how they change each month and understand the market forces behind them.

SubscribeDownload Historical Data Points (xls)

Long Bottom

  February 2024 Year-over-year change 2-year stacked change Month-to-month change Month-to-month change (SA*)
Cass Freight Index - Shipments 1.115 -4.5% -4.8% 7.3% 2.0%
Cass Freight Index - Expenditures 3.225 -19.8% -27.6% 4.0% 1.8%
Cass Inferred Freight Rates 2.892 -16.0% NA -3.1% -0.2%
Truckload Linehaul Index 140.50 -5.4% -11.1% 0.1% NA


* SA = seasonally adjusted

Cass Freight Index - Shipments

The shipments component of the Cass Freight Index® rose 7.3% m/m in February, as operations recovered from weather effects and with a Leap Day, which was the main factor behind the 2.0% m/m increase in seasonally adjusted (SA) terms.

  • On a y/y basis, the index declined 4.5% y/y—the smallest decline in ten months.
  • While seasonality remains soft in the near term and there are no more extra days on the calendar, underlying volumes have shown improvement. In Q1, the shipments component of the Cass Freight Index is set to rise about 3% from Q4’23 in SA terms, less than 1 percentage point (pp) of which can be attributed to Leap Day.
  • It’s been over two years since the first y/y decline of this freight recession, and with destocking playing out and goods consumption rising, we see this improvement as an encouraging sign that a recovery is beginning.
  • Real disposable incomes slowed to start 2024, but goods prices are now declining overall, and with the ongoing strong labor market, freight demand fundamentals are improving.

After rising 0.6% in 2022, the index declined 5.5% in 2023. With normal seasonality, the index will fall just 1% y/y in March and turn positive y/y in May.


Cass Freight Index Shipments February 2024


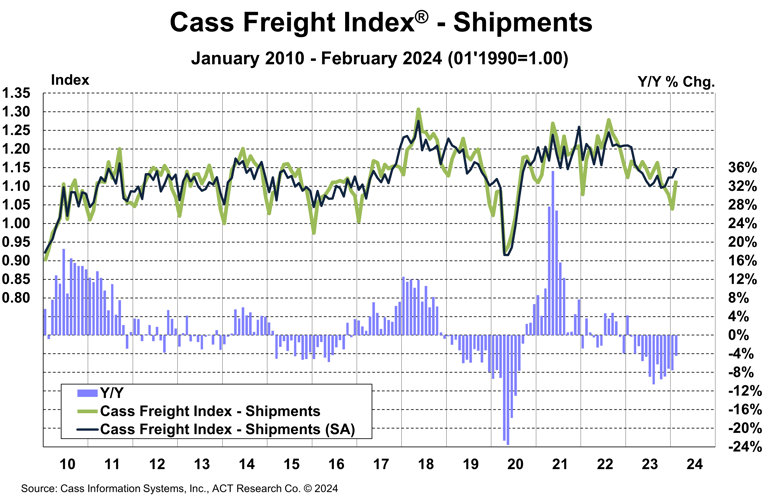
See the Methodology for the Cass Freight Index


Cass Freight Index - Expenditures

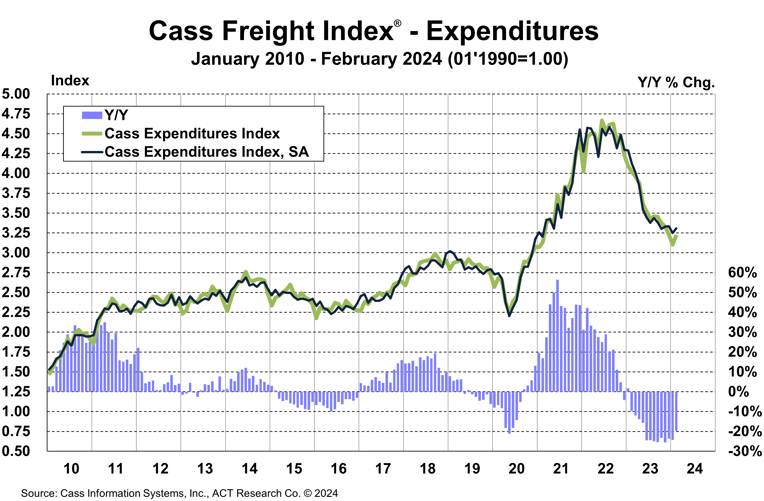
The Expenditures component of the Cass Freight Index, which measures the total amount spent on freight, rose 4.0% m/m, but fell 20% y/y in February.

With shipments up 7.3% m/m, we infer overall rates were down 3.1% m/m in February (see our inferred rates data series below).

  • The index rose 1.8% m/m (SA), with shipments up 2.0% and rates down 0.2%.  

This index includes changes in fuel, modal mix, intramodal mix, and accessorial charges, so is a bit more volatile than the cleaner Cass Truckload Linehaul Index®.

U.S. freight spending, as measured by the expenditures component of the Cass Freight Index®, fell 19% in 2023, after a record 38% surge in 2021 and another 23% increase in 2022. It is set to decline about another 14% in 1H’24, assuming normal seasonal patterns from here. 


Cass Freight Index Expenditures February 2024


Inferred Freight Rates

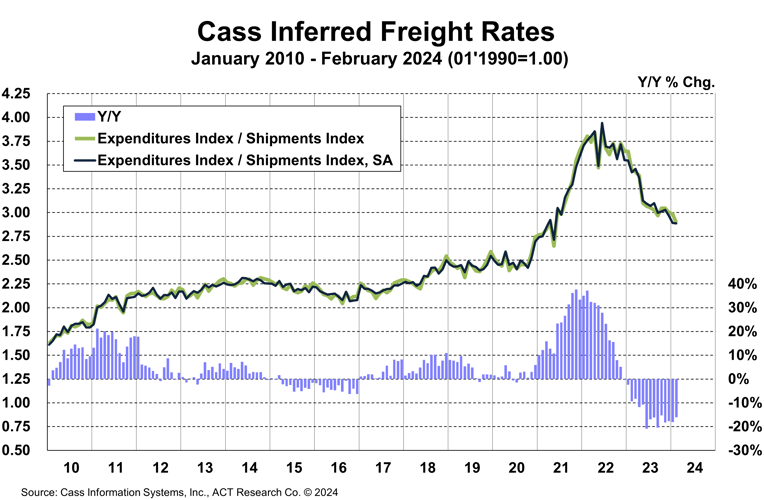
Cass Inferred Freight Rates are a simple calculation of the Cass Freight Index data—expenditures divided by shipments—producing a data set that explains the overall movement in cost per shipment. The data set is diversified among all modes, with truckload (TL) representing more than half of the dollars, followed by less-than-truckload (LTL), rail, parcel, and so on.

The rates embedded in the two components of the Cass Freight Index® declined 16% y/y in February, and have now declined 15%-21% for nine straight months.

  • Cass Inferred Freight Rates fell 0.4% m/m SA, marking a new cycle low, though the declines are slowing.  
  • Based on the normal seasonal pattern, this index would fall slightly m/m in March, with a similar y/y decline.

The normal seasonal pattern from here would put inferred rates down 13% y/y for 1H’24, and down 9% for the full year.


Cass Inferred Freight Rates February 2024


Download the Data

Truckload Linehaul Index

Stability continued for the Cass Truckload Linehaul Index® in February, with a 0.1% m/m increase after falling by 0.6% m/m in January. The 5.4% y/y decline was the narrowest in the past year.

  • The index has been in a very tight range from 140.4 to 142.0 over the past eight months as the market rebalances.
  • As a broad truckload market indicator, this index includes both spot and contract freight.

With spot rates steady over the past several months, downward pressure on the larger contract market is lessening, with some instances of contract rate increases bucking the downtrend recently. 


Cass Truckload Linehaul Index February 2024


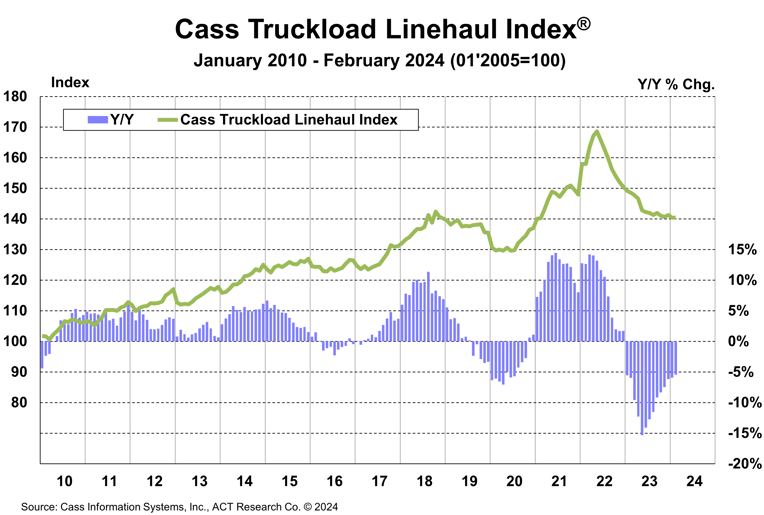
See the Methodology for the Cass Truckload Linehaul Index


Freight Expectations

While the freight cycle is certainly stabilizing with rates below sustainable levels in many cases and little room for further savings, we’re also seeing surprisingly strong new equipment orders for this point in the cycle. In our view, planning for upcoming emissions regulations is likely a key factor. These capacity additions suggest the long bottom in the freight cycle may lengthen even further. 

Our outlook through 2026 is detailed in the ACT Research Freight Forecast. This service provides in-depth analysis and forecasts for a broad range of U.S. freight measures, including the Cass Freight Index, Cass Truckload Linehaul Index, and DAT spot and contract rates by trailer type, LTL, and intermodal price indexes. We provide monthly, quarterly, and annual predictions for over 40 data series over a two- to three-year time horizon, including capacity, volumes, and rates. The ACT Research Freight Forecast is released monthly in conjunction with the Cass Transportation Index report.

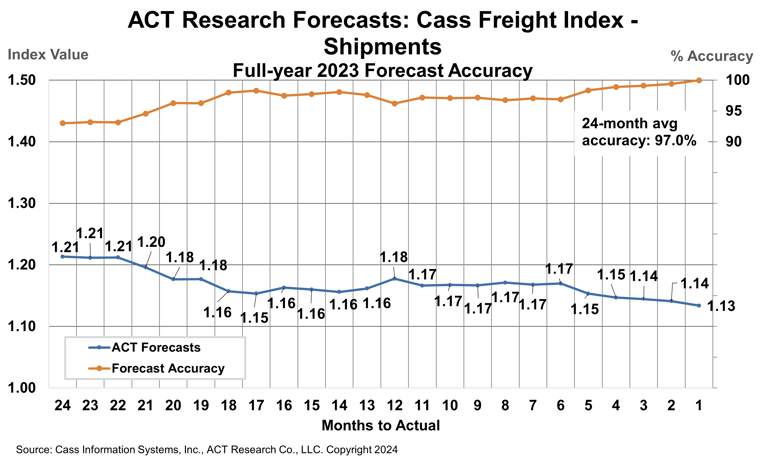
How have ACT Research’s freight forecasts performed? For 2023, ACT’s forecasts for the shipments component of the Cass Freight Index were 96.9% accurate on average for the 24-month forecast period. 

(As a reminder, ACT Research’s Tim Denoyer writes this report.)


ACT Forecast Accuracy 2023 Shipments


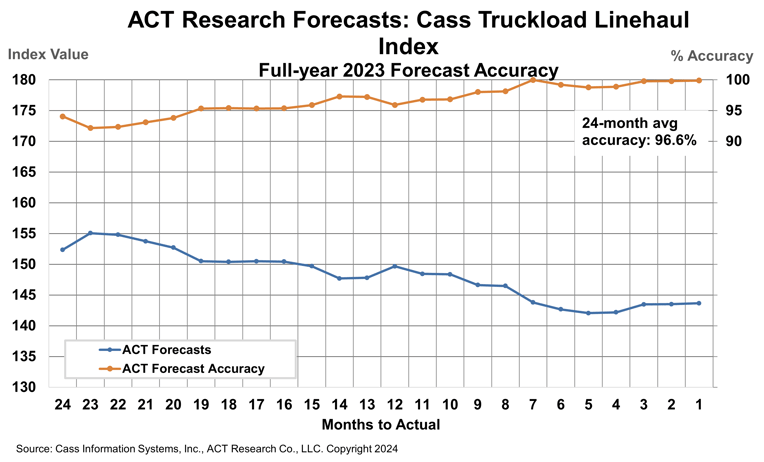
ACT Research’s 2023 forecasts for the Cass Truckload Linehaul Index were 96.6% accurate on average over the past 24 months, and 98.5% accurate over the past 12 months. The Cass Truckload Linehaul Index averaged 143.8 in 2023, precisely in line with our July 2023 estimate. 


ACT Forecast Accuracy 2023 Cass TL LH Index


Release date: We strive to release our indexes on the 13th of each month. When this falls on a Friday or weekend, our goal is to publish on the next business day.

Tim Denoyer head

About the Author: Tim Denoyer, ACT Research

Tim Denoyer joined ACT Research in 2017 after spending fifteen years in equity research focused primarily on the transportation, machinery, and automotive industries. Tim is a senior analyst leading ACT’s transportation research effort and the primary author of the ACT Freight Forecast, U.S. Rate and Volume OUTLOOK. Research associate, Carter Vieth, who joined ACT in early 2020 after graduating from Indiana University, also contributes to the report. This report provides supply-chain professionals with better visibility on the future of pricing and volume in trucking, the core of the $1.2 trillion US freight transportation industry, including TL, LTL, and intermodal. 

Tim also contributes to ACT’s core Classes 4-8 commercial vehicle (CV) data analysis and forecasting; powertrain development, such as electrification analysis; and used truck valuation and forecasting. Tim has supported or led numerous project-based market studies on behalf of clients in his six years with ACT on topics ranging from upcoming emissions and environmental regulations to alternative powertrain cost analyses, to e-commerce and last-mile logistics, to autonomous freight market sizing.  

ACT’s freight research service leverages its expertise in the supply-side economics of transportation and draws upon Tim’s background as an investment analyst, beginning at Prudential and Bear Stearns. Tim was a co-founder of Wolfe Research, one of the leading equity research firms in the investment industry. His experience also includes responsibility for covering the industrial sector of the global equity markets, including with leading investment management company Balyasny Asset Management.

Disclaimer

The material contained herein is intended as general industry commentary. The Cass Freight Index, Cass Truckload Linehaul Index (“Indexes”), and other content are based upon information that we consider reliable, but Cass does not guarantee the accuracy, timeliness, reliability, continued availability or completeness of any information or underlying assumptions, and Cass shall have no liability for any errors, omissions or interruptions. Any data on past performance contained in the Indexes is no guarantee as to future performance. The Indexes and other content are not intended to predict actual results, and no assurances are given with respect thereto. Cass makes no warranty, express or implied. Opinions expressed herein as to the Indexes are those of ACT Research and may differ from those of Cass Information Systems Inc. All opinions and estimates are given as of the date hereof and are subject to change.

Receive Index updates straight to your inbox