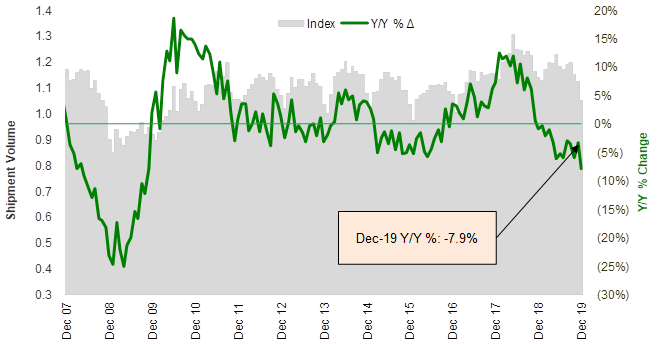
It wasn’t the prettiest month for the Cass Index, which means it wasn’t the best month in the freight world. Both the shipments and expenditures components of the Cass Freight Index marked their lowest reading of 2019 and took another step backwards in terms of y/y growth. There is lots of hope in the stock market and the freight market for a better 2020, but the trends have yet to turn. Maybe with the January index readings? Doubtful, as the index (both shipments and expenditures) normally falls off sequentially from December to January, which would imply another negative y/y comp ahead. Our view is that the second quarter of 2020 has the best chance of seeing actual y/y growth in shipments and freight costs, if traditional seasonal freight patterns hold, as the second quarter of 2019 did not see the typical seasonal surge in activity.
Shipment volumes dropped 7.9% vs December 2018 levels, as the index posted its lowest reading since January 2018. It was also the steepest y/y decline since the Great Recession of 2008-2009. Although there were the same number of working days in December 2019 and December 2018, some industry participants we’ve spoken with about the sluggish end to the year cited Christmas and New Year’s Day both falling on a Wednesday as the reason for soft volume and low productivity the last week or so.
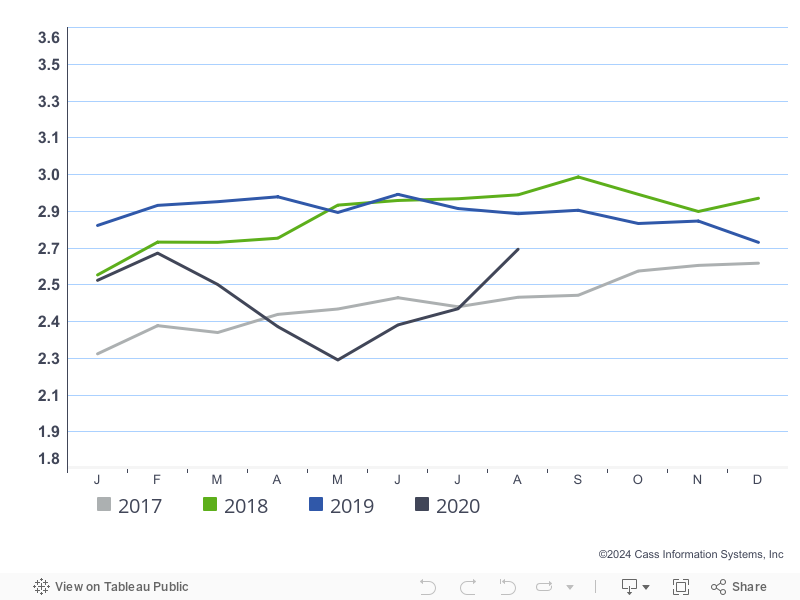
Source: Cass Information Systems and Stifel Research
To activate the data download feature, double click within the chart area and then select the download icon.
Click here to receive a monthly alert when new data is released.
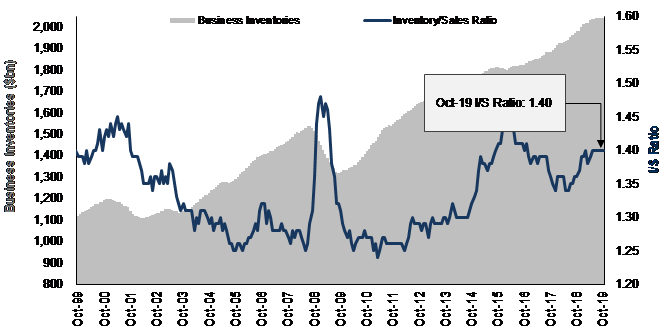
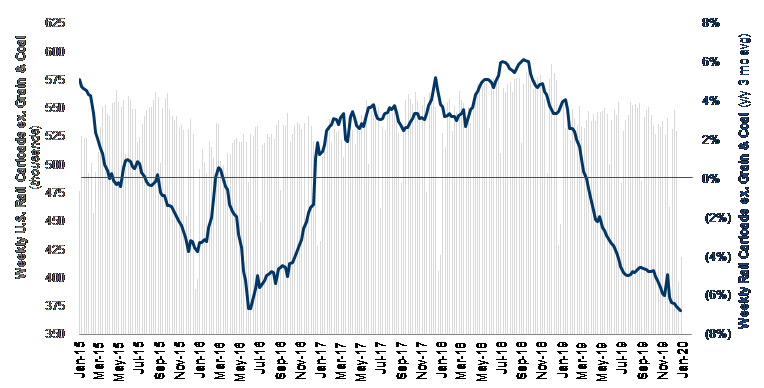
Regardless of the holiday effect, the freight market is weak, largely due to higher inventories and contraction in the manufacturing economy, as noted by December’s 2019-low ISM reading of 47.2 (its lowest level since June 2009). We saw corroborating evidence from the rail data (Chart 3), which showed deceleration through the end of the year as well. And while we expect comps to ease and volumes to flatten out, we are not forecasting much growth in terms of freight volumes in 2020. The U.S. industrial economy – rebound or no rebound – will likely be the biggest swing factor. And the tariff relief from the Phase 1 deal seems to be just that – a relief for some, but not a stimulus.
Source: U.S. Census Bureau and Stifel Research
Source: Association of American Railroads and Stifel Research

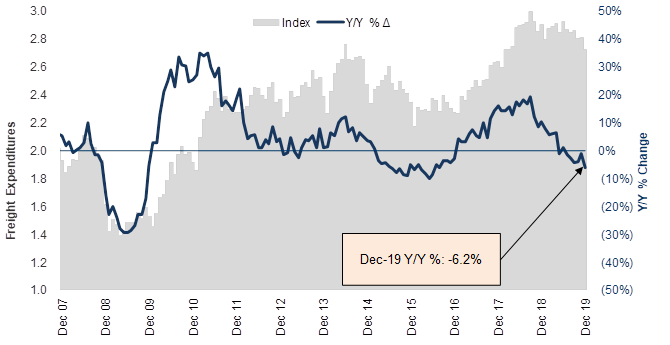
Cass Freight Index - Expenditures
Freight expenditures also fell, down 6.2% y/y (Chart 4), but not quite as much as volumes, as industry pricing was generally higher than year-ago levels. The big drop sequentially (from -1.4% y/y in November) was a result of December 2019 seeing less spent on freight than November, whereas in 2018 it was the opposite – more was spent on freight in December than November due to the capacity crunch that led to a premium for holiday freight that year.
Since the Cass Freight Index is a mix of freight modes (but >50% truckload), the outperformance of expenditures vs volumes reflects the better pricing power exhibited by the rail, intermodal, parcel, and LTL sectors. We expect transport pricing growth to moderate in 2020 but remain inflationary, so our forecast is for freight expenditures to modestly outpace a generally flattish volume environment. And our best estimate on fuel (a significant part of overall freight costs) is that it stays roughly flat from here. IMO 2020 has had no material impact on diesel prices to-date as some had feared.
To activate the data download feature, double click within the chart area and then select the download icon.
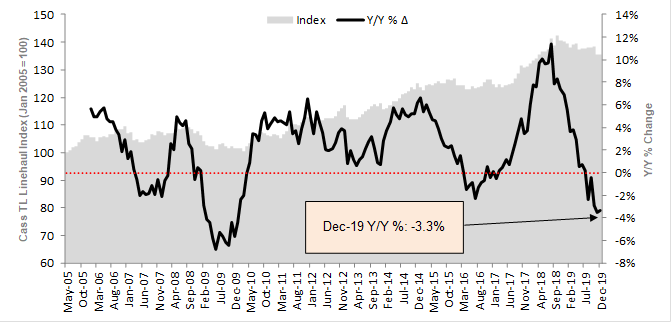
The Truckload (TL) Linehaul Index, measuring per-mile linehaul rates, takes a look at the largest (and most fragmented) market in the domestic transportation landscape, and it showed a y/y decline of 3.3% in December (vs -3.5% in November).
The focus in the coming quarters will be on the capacity situation (how many trucks are chasing what was throughout 2019 a shrinking amount of freight) and how that may unfold in the first half of 2020 with some regulatory changes (AOBR to ELD conversion – effective last month) and then the Drug & Alcohol Clearinghouse (where the database crashed Week 1), plus rising pressure on insurance costs (to unreasonably high levels, according to carriers in the industry who are trying to figure out how to pay for it with no pricing power at the moment). Conventional wisdom presently appears to be that supply and demand will find equilibrium around mid-year, and spot rates will resume their premium to contract rates and give contract rates room to rise again in 2021.

To activate the data download feature, double click within the chart area and then select the download icon.
Furthermore, we show in the graph below that the Cass Truckload Linehaul Index has a strong correlation to the quarterly yield metrics reported by the publicly traded TL carriers. This index should be watched intra-quarter to see any changes to trends that may impact the stocks. Given December ended the year in-line with November comps, and from conversations we’ve had with several carriers this past week, we believe the fourth quarter of 2019 will be another soft quarter for both pricing and volumes among trucking companies.
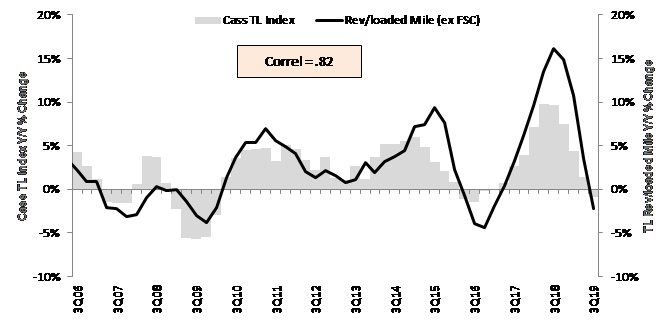
Source: Cass Information Systems, public carrier data and Stifel research
Note: All historical truckload and intermodal data was restated in November 2019, with an extremely high correlation to the previous data.
There is some hope that the increase in spot rates seen in December (but not obvious in the Cass Index for Expenditures, because most freight is moved in the contract market, not the spot market) will lead to better rates next year, but we believe the first few weeks of December to have been unusual and that spot rates are likely to fall again in January, unless significant capacity is removed due to fleet failures.
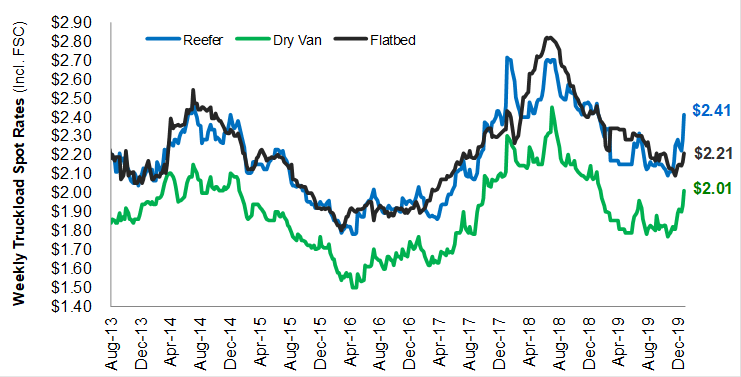
Source: DAT Solutions
The Cass Intermodal Price Index, measuring total per-mile costs, looks at the smaller intermodal market and shows that rates are still positive, up 0.7% year over year in December (vs +2.8% y/y in November). Like the pricing, volumes also decelerated to end 2019, as they ran up against a difficult comp related to the shipping that was rushed in at the end of 2018 ahead of the tariffs. We believe the rates should strengthen again when TL rates begin increasing in 2020, as truckload pricing continues to weigh some on intermodal pricing (but even more on intermodal volumes). The intermodal providers have done a nice job maintaining price discipline, and the improved rail service should allow for higher rates ahead, in our opinion.
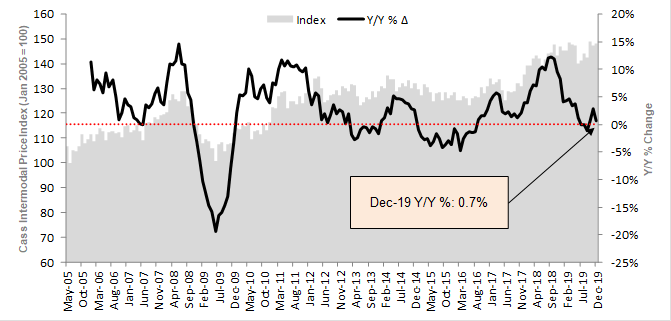

To activate the data download feature, double click within the chart area and then select the download icon.
Note: All historical truckload and intermodal data was restated in November 2019, with an extremely high correlation to the previous data.