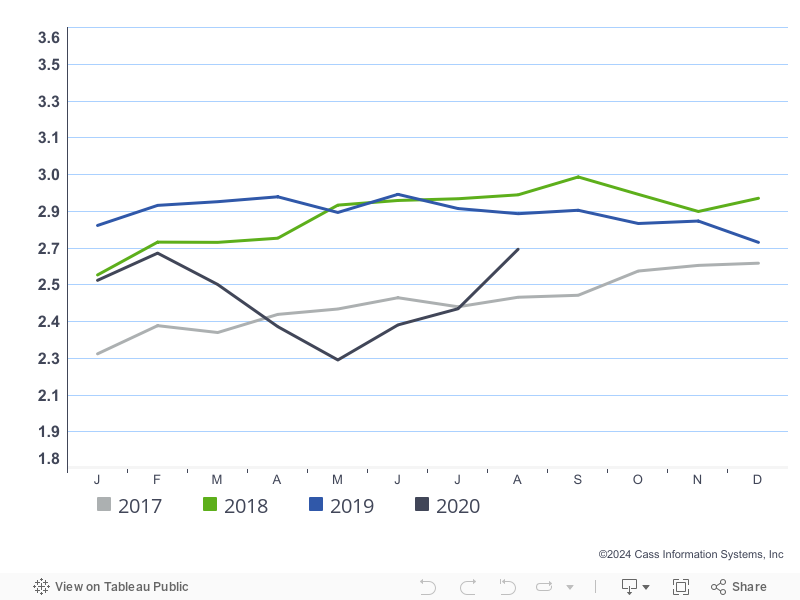
Related specifically to how much is moving, Cass Freight Index shipment volumes were down 7.6% vs year-ago levels (Chart 1), much better than last month’s (-13.1%) y/y change, and the best comp reported since February (pre-pandemic). The raw index number shot up 8% from July’s level, an acceleration in trend. The shipment index is now 19.1% higher than the April lows and at the highest absolute level since November 2019. And we see it moving higher through year-end, as inventories remain relatively lean.
Chart 1 – The index is now back above pre-pandemic freight levels, as the re-opening continues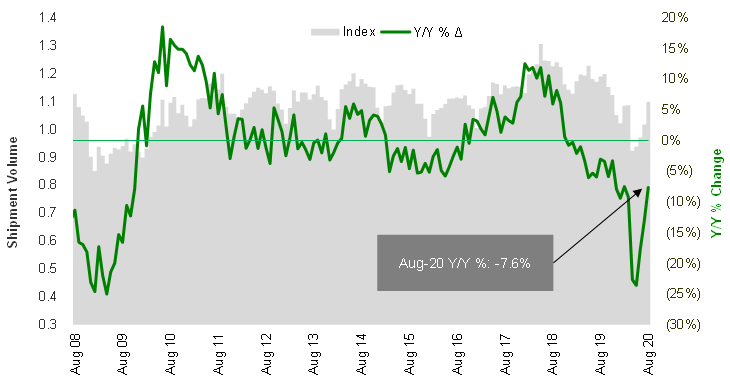
Source: Cass Information Systems, Inc and Stifel research
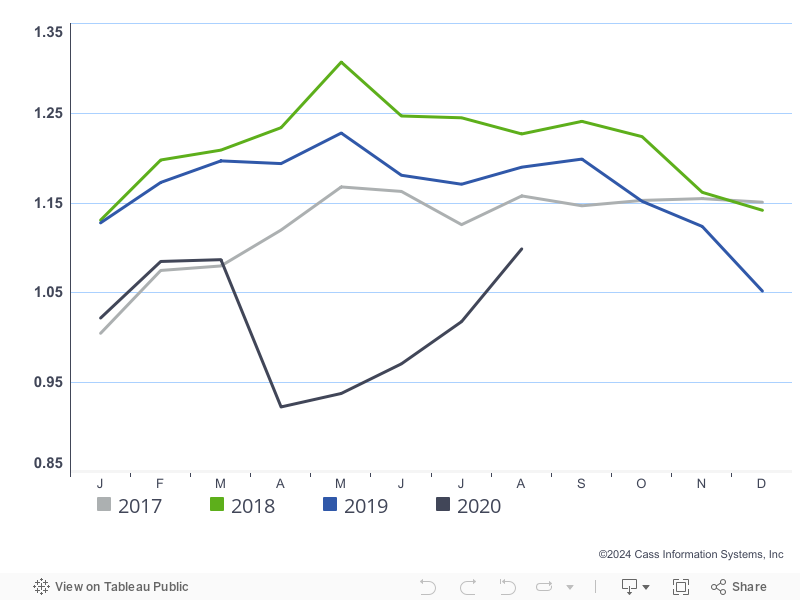
Chart 2 – Shipment volumes moving in the right direction
To activate the data download feature, double click within the chart area and then select the download icon.
Click here to receive a monthly alert when new reports are released.
It would likely be even higher, but consumer confidence, while stabilized somewhat, remains low (Chart 3) compared to “good times.” Of course, that’s understandable, given how many (Chart 4) are still out of work. Government stimulus may or may not continue to help.
Chart 3 – Consumer still not enthusiastic
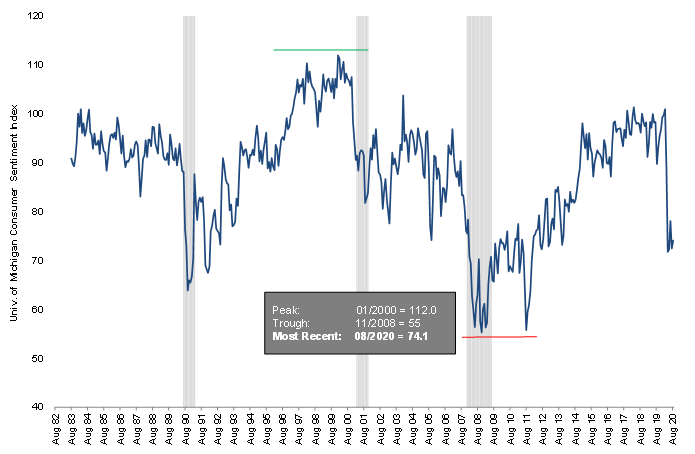
Source: University of Michigan
Chart 4 – Many still out of a job
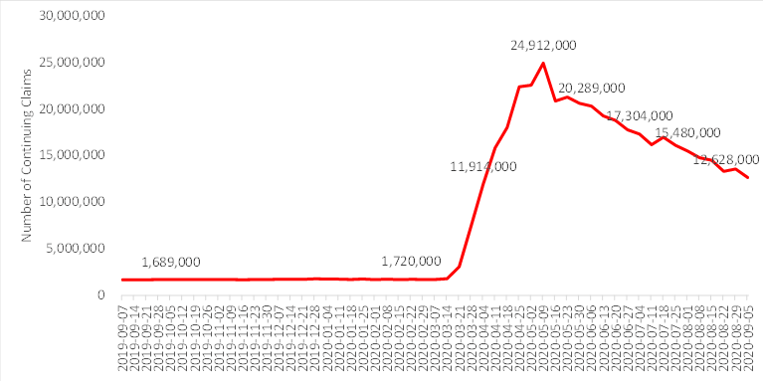
Source: Federal Reserve Bank of St. Louis
Leading much of this improved goods movement seen in the shipment index is import activity, which has been growing again in the summer months. Particularly on the West Coast ports, due to what’s been termed an “inventory dump,” companies are bringing in more of their containers than usual to the West Coast ports and then moving truck or rail inland from there to help with low inventory levels. They’re choosing to pay higher transport costs to keep goods in stock rather than wait for the extended transit time it takes for containers from Asia to travel all the way to East Coast U.S. ports. August container volumes grew double digits at the Ports of L.A. and Long Beach (Chart 5) – the fastest growth we’ve seen since the rush in 2018 to pre-ship and avoid potential tariffs.
In the air, international airfreight volumes remain strong. They are strongest out of Asia, even as PPE demand has waned and moved to ocean. Cargo capacity is still the biggest issue, with most commercial belly capacity staying out of the market until mid-2021 at the earliest. Freighters have been operating close to peak levels this quarter, so peak season ahead in 4Q20 will be tight and airfreight yields high.
Chart 5 – Imports hopping at West Coast ports
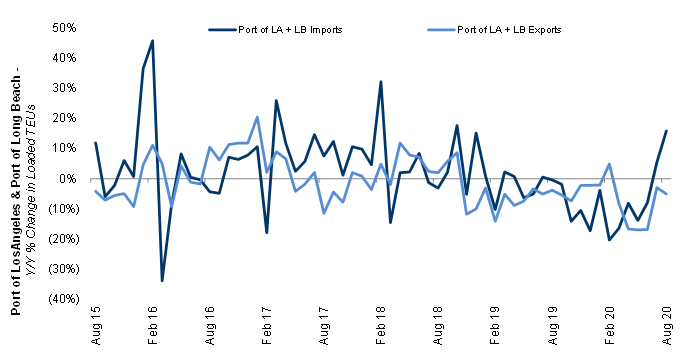
Source: Port of Los Angeles, Port of Long Beach
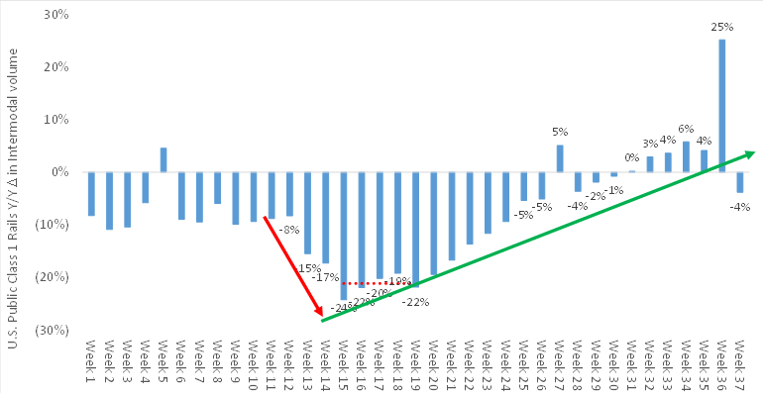
The weekly rail traffic data (Chart 6) showed further improvements through September. This data set typically tracks similar to the Cass Freight Index (Chart 7), and while directionally still accurate, the more truckload heavy Cass volumes are returning more slowly in this recovery. As the rail volume comps continue to improve, we expect it to be favorable for Cass Index trends as well. September should be a better month.
Chart 6 – Adjusting for the Labor Day comp issue, rail volume trends continue to move closer to flat y/y
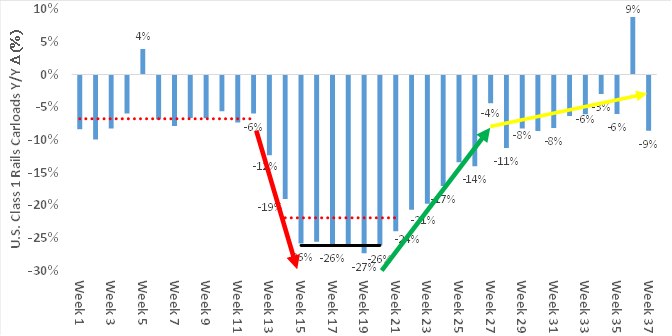
Note – Week 37 carloads are originations through the week of 9/17/2020 for BNSF, CSX, KSU, NSC, and UNP
Source: Association of American Railroads and Stifel research
Chart 7 - Cass and rail volumes trending in same direction
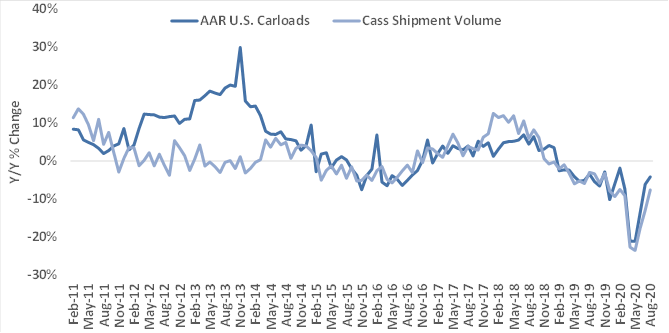
Source: Association of American Railroads, Cass Information Systems, and Stifel estimates
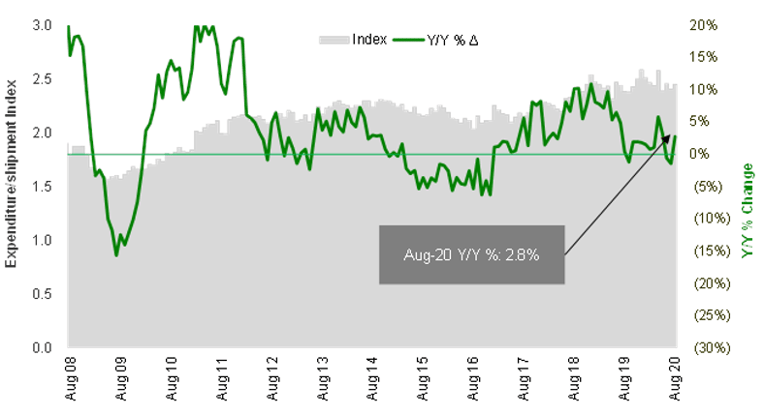
With respect to overall spend on transportation, the Cass Index freight expenditures were down 5.1% y/y in August (Chart 8) – 10% higher than last month, 20% better than May’s low, and the highest freight spend we’ve seen since December 2019 (and that’s with significantly less contribution from fuel surcharge revenue – Exhibit 10).
Chart 8 – Expenditures moving up faster than volumes due to capacity squeeze
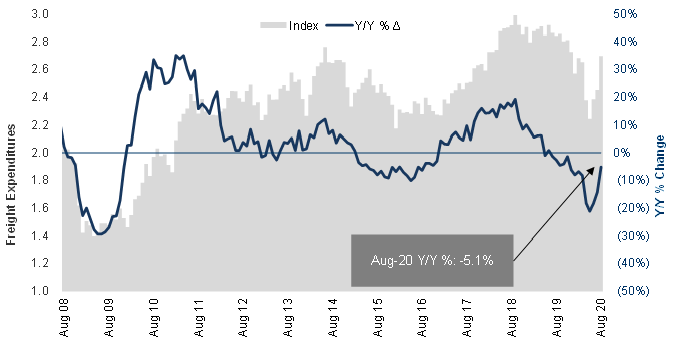
Source: Cass Information Systems, Inc. and Stifel research
Chart 9 – Spending on freight reaches 2017 levels
To activate the data download feature, double click within the chart area and then select the download icon.
Chart 10 – Diesel prices lower y/y but ready, weighing on dollars/bill (yield)
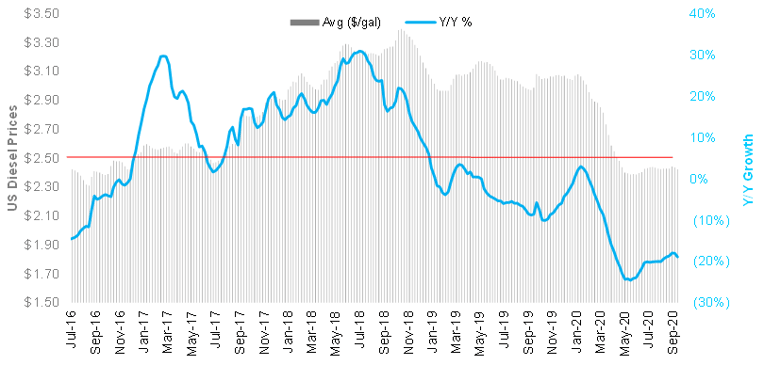
Source: Energy Information Administration
For carriers, revenue per shipment (simply the expenditures index divided by shipments) trends have reversed and are increasing (Exhibit 11) due to rising trucking rates, as there are real constraints on driver and industry supply presently. We don’t see much capacity entering or returning the rest of the year, so as supply/demand remains tight, expect continued growth in the average freight bill.
Chart 11 - Revenue per shipment moving higher, as capacity has tightened in the truckload market
Source: Cass Information Systems and Stifel research
The Cass Truckload Linehaul Index (Chart 12), which measures per-mile linehaul rates and takes a look at the largest (and most fragmented) market in the domestic transportation landscape, declined 4.3% y/y in August. Still, this was the highest reading of 2020, indicating a turn in truckload pricing.
Supply is the main driver of this phenomenon, with help, of course, from improving volumes. Even as contract rates are only starting to move higher, shippers are having to pay more to get their freight moved, as carriers are turning away load requests with high frequency. This is evident when we look at spot rates (Chart 14) posted in August (and September to-date). The pricing outlook remains bullish for carriers, as spot rates are tracking much higher y/y (including fuel surcharges) in the dry van, flatbed, and reefer markets, with dry van actually above 2018 peak levels. The rebound in rates from here will just depend on the strength of the recovery coupled with the sustainability of industry supply constraints.
Chart 12 – Truckload Linehaul Index turning up
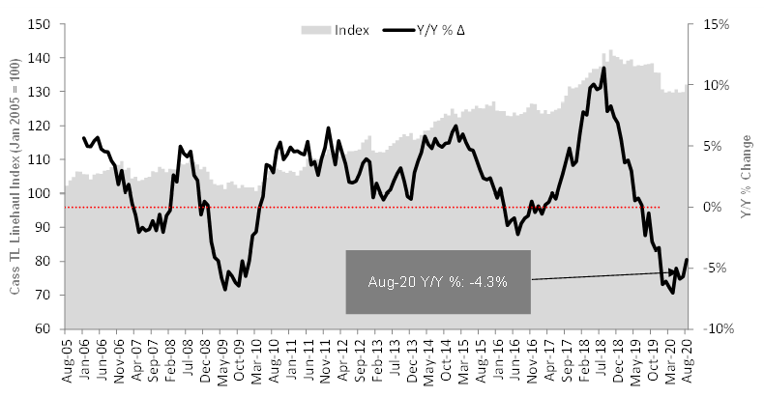
Source: Cass Information Systems, Inc. and Stifel research
Chart 13 – Truckload linehaul rates higher than three years ago

To activate the data download feature, double click within the chart area and then select the download icon.
Chart 14 – All truckload segment spot rates near, at, or above high 2018 levels
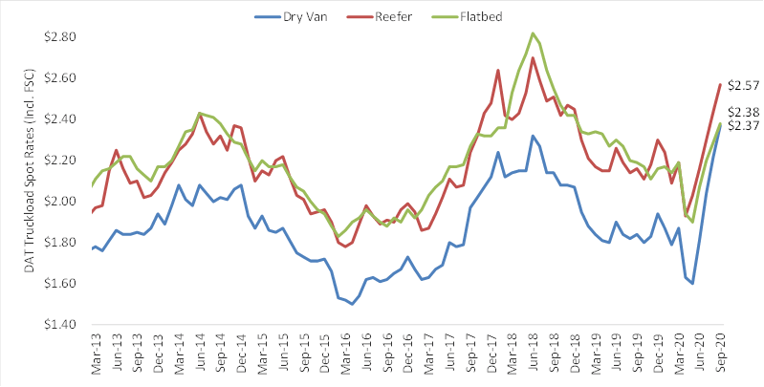
Source: DAT Solutions, through week ended 9/13/20
As we’ve said before, the Cass Truckload Linehaul Index (Chart 15) has a strong correlation to the quarterly yield metrics reported by the publicly traded TL carriers. August data is evidence of a turn for the better for asset-based carriers.
Chart 15 – Cass Truckload Linehaul index shows a turn underway in 3Q20-4Q20 with public carrier rates
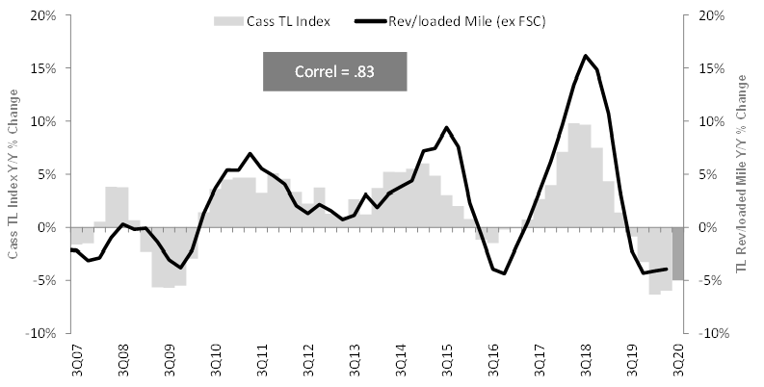
Source: Cass Information Systems, Inc., public carrier data, and Stifel research
The Cass Intermodal Price Index (Chart 16), measuring total per-mile costs, looks at the smaller intermodal market and shows much worse trends than TL, falling to a new low of -18.9% y/y in August (but rising 1% sequentially from July). This has two main drivers: 1) The fuel surcharge – while the Cass Truckload Linehaul Index excludes fuel surcharge, the intermodal index includes fuel surcharges, and 2) Intermodal pricing has been on a lag vs TL pricing, so as intermodal demand improves further (Chart 18) and TL contract rates move higher, intermodal rate increases should follow.
Chart 16 – Cass Intermodal Price Index off big vs 2019 due to lower fuel lag vs TL rates
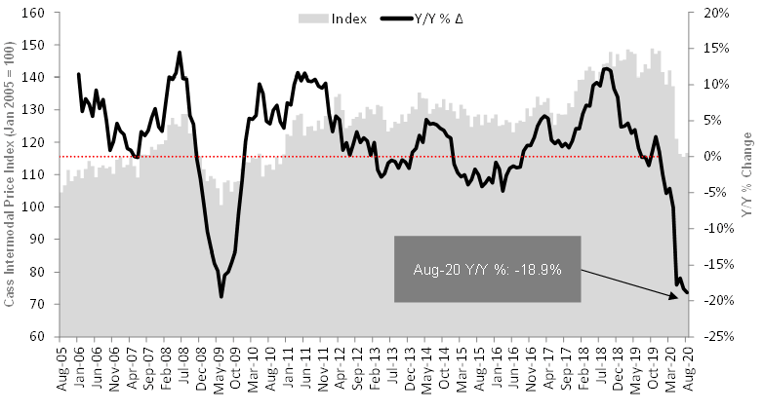
Source: Cass Information Systems, Inc., public carrier data, and Stifel research
Chart 17 – Intermodal costs almost 19% below last year and the year before

To activate the data download feature, double click within the chart area and then select the download icon.
Chart 18 – Intermodal volumes are growing, and with truck rates higher, expect intermodal pricing to turn soon
Note – Week 37 carloads are originations through the week of 9/17/2020 for BNSF, CSX, KSU, NSC, and UNP
Source: AAR
In summary, the Cass Freight Index showed accelerated progress in August, and we expect this to continue to improve as we finish the third quarter. Pricing is moving up faster than volumes, and volumes are expected to remain healthy (at/above current levels) for the next few months.