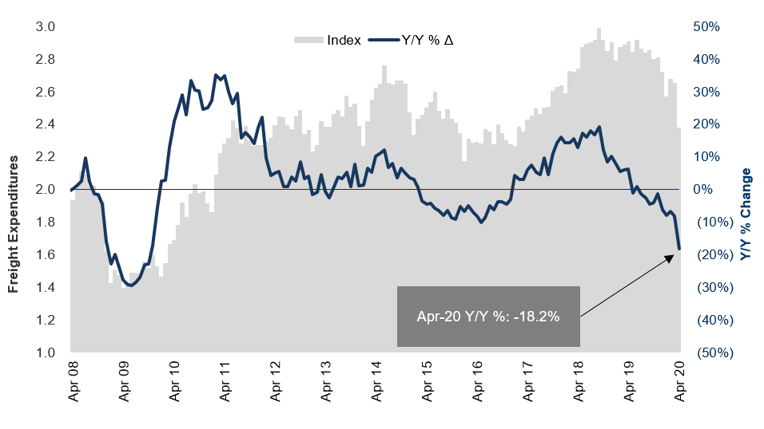
Shipment volumes dropped 22.7% vs April 2019 levels (Chart 1), and we believe this will mark the bottom. May should be better, as the U.S. economy slowly begins to re-open and some manufacturing plants turn back on (many automotive OEMs are targeting plant re-openings in the next week or two). Among the carriers, April was much like March in that if you moved groceries, home improvement, e-commerce, and consumer staples, you had steady demand, while restaurant, auto, and (mall) retail were essentially not moving anything.
Chart 1 – April's shipments index dropped all the way back to 2009 levels
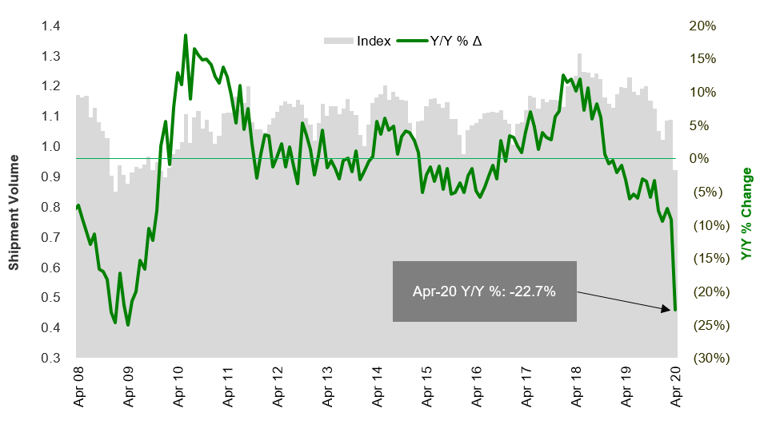
Source: Cass Information Systems and Stifel research
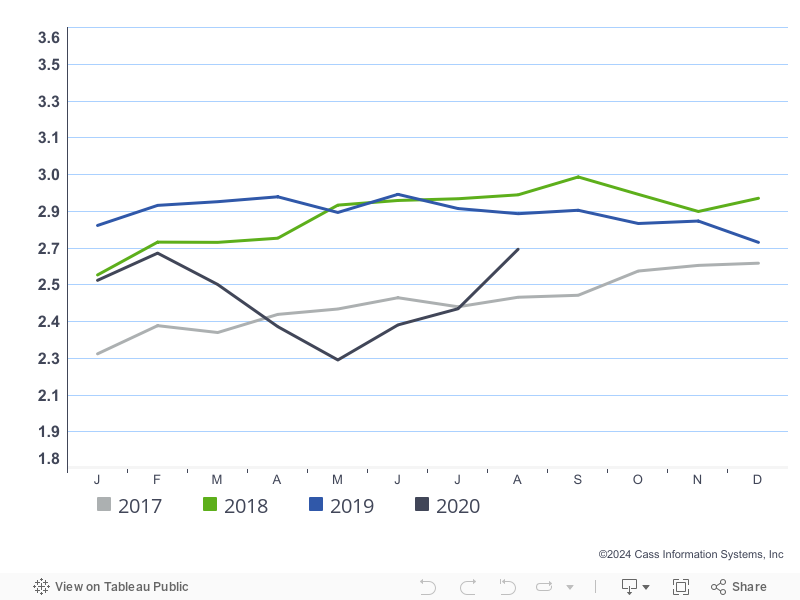
Chart 2 – Cass Freight Index - Shipment Volumes
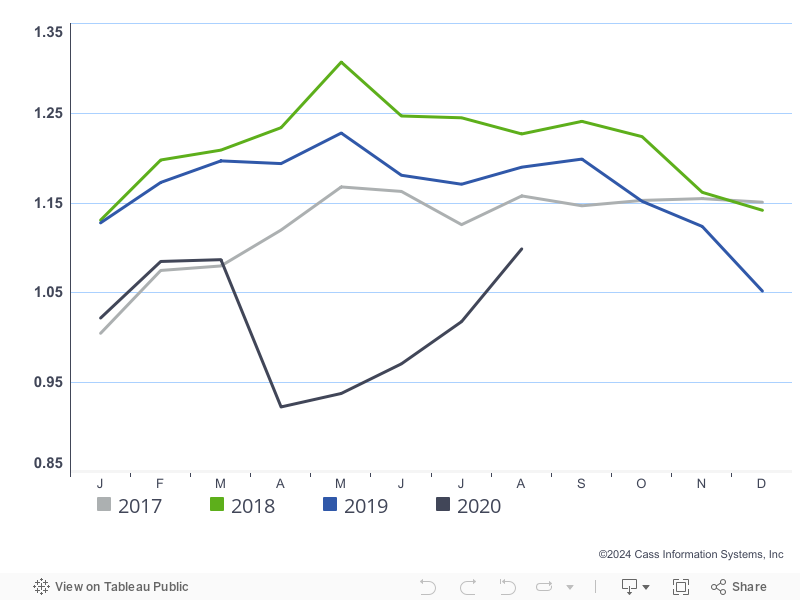
To activate the data download feature, double click within the chart area and then select the download icon.
Click here to receive a monthly alert when new data is released.
We are just wrapping up earnings season, where the public companies have reported 1Q20 financials to Wall Street the last few weeks, and the April demand commentary has been consistent with these Cass readings. Volumes declined anywhere from 10%-25% for most carriers across most modes in the U.S., including truckload, LTL, intermodal, and rail. The long bright spot (besides Dedicated for “essential” carriers) was in small package, where UPS is still reporting y/y growth in April volumes, but there has been a big change in the mix of what they’re hauling – from about 50/50 B2B/B2C to 30/70 B2B/B2C – reflecting the surge in e-commerce volumes with businesses closed and people remaining in their homes for an extended period.
Consumer confidence remains very poor into May (Chart 3), as there is uncertainty over what happens next. We’ve never seen anything like this, so it is impossible to predict exactly what it will mean for freight as we move through the year. There are many paths and shapes we could take as an economy in the next few quarters.
Chart 3 – April consumer confidence fell sharply but is not as bad (yet) as the Great Recession
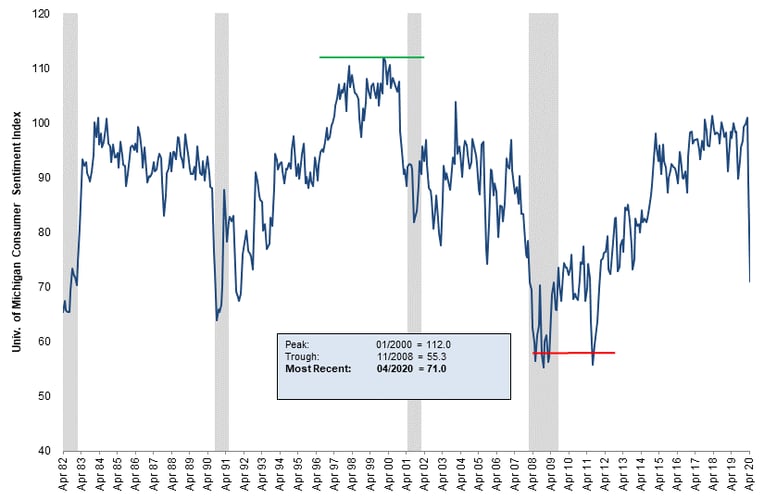
Source: University of Michigan
On the international side, we saw April container imports at the Port of Long Beach decline 20% y/y. Airfreight volumes are also soft, but that market remains tight and yields high due to a steep drop-off of available passenger belly space (which used to represent 50% of global cargo capacity), which is not expected to return anytime soon.
The weekly rail traffic data (Chart 4), excluding coal and grain shipments, typically tracks similar to the Cass Shipments Index, and that was again the case in April. Through this month, we expect these numbers to get “less bad,” as a sign the freight market is recovering, although we also believe they will remain well below year-ago levels for months.
Chart 4 – U.S. rail traffic significantly worsened in April but trying to find a bottom
Note – Week 18 carloads are originations through the week of 5/2/2020
Source: Association of American Railroads and Stifel research
Cass Freight Index - Expenditures
Back to the Cass numbers, freight expenditures also fell in April, down 18.2% y/y (Chart 5). Initially when seeing the Cass volume numbers, we expected this index to be hit even harder – especially with the intermodal and truckload linehaul indexes dropping and fuel declining (Chart 7). How could freight spend be down less than volumes, if rates were going lower? We believe it was a mix issue in that the freight that was moving was higher revenue per shipment, due to longer average length of haul (which has a negative impact on TL yield). So, those customers who remained opened for business had a higher freight cost per shipment than those who were closed. We believe expenditures on an apples-to-apples basis were down more than volume and lower fuel surcharges will continue to provide shippers some relief on freight costs in the near-term.
Chart 5 – Expenditures hit - but not quite as bad as 2009
Source: Cass Information Systems, Inc. and Stifel research
Chart 6 – Cass Freight Index - Expenditures
To activate the data download feature, double click within the chart area and then select the download icon.
Chart 7 – Steep decline in diesel prices helping to lower shipment costs through lower fuel surcharges
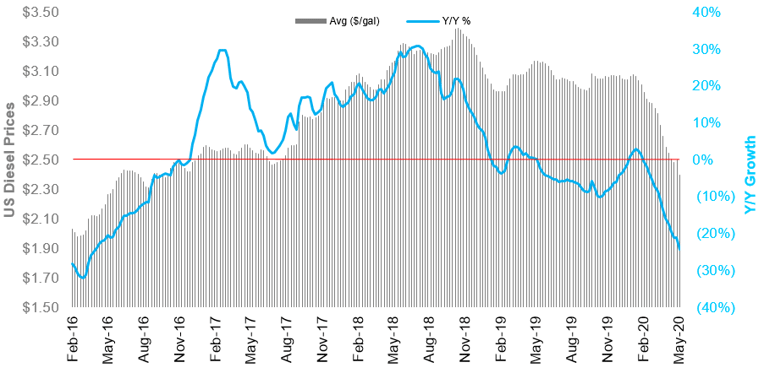
Source: Energy Information Administration
The Truckload (TL) Linehaul Index (Chart 8), measuring per-mile linehaul rates, takes a look at the largest (and most fragmented) market in the domestic transportation landscape, and it declined 7.0% y/y in April (the worst comp reported in the last 15 years), as rates felt the impact of the volume drop last month.
Supply and demand determine truckload rates, and there’s really nowhere to hide when volumes take a step down as dramatically as we saw in April. From here, the question is whether this negative industry pricing is enough to flush out capacity. And if so, how much? Because, if 5% of truck capacity is removed, it doesn’t necessarily mean rates will improve, as volumes could stay down 10% or more. We are watching carefully both the demand side and the supply side to see when rates may again move in the carriers’ favor.
Chart 8 – The Cass Truckload Linehaul Index falls further – back to global financial crisis levels
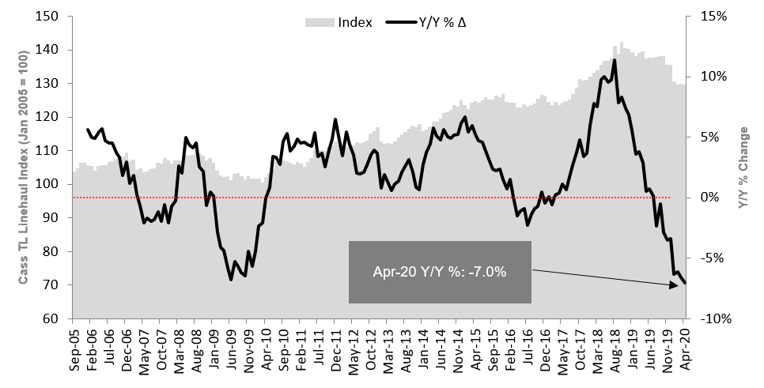
Source: Cass Information Systems, Inc. and Stifel research
Chart 9 – Cass Truckload Linehaul Index

To activate the data download feature, double click within the chart area and then select the download icon.
Again, we see (Chart 10) the Cass TL Linehaul Index has a strong correlation to the quarterly yield metrics reported by the publicly traded TL carriers. And this indicates that TL yields continue to fall further so far in 2Q20. As we move through this quarter, it will be helpful to watch how the Cass index moves to see how public carrier numbers may look when they next report in late July.
Chart 10 – Cass Truckload Linehaul index indicates public carrier yields weakened further to start 2Q20
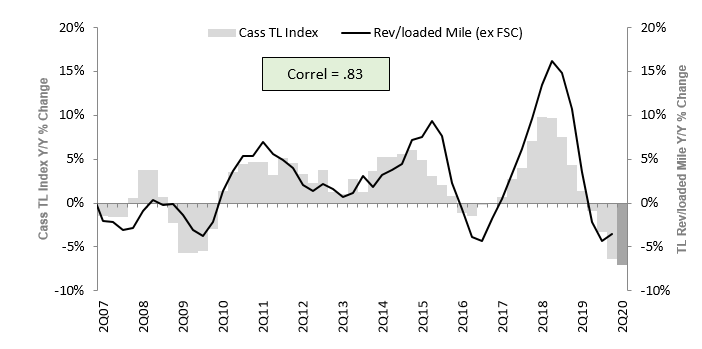
Source: Cass Information Systems, public carrier data, and Stifel research
Note: All historical truckload and intermodal data was restated in November 2019, with an extremely high correlation to the previous data.
After a strong March rebound, spot rates (Chart 11) in April collapsed back down near early 2016 lows. Rates are currently tracking down 14%-15% y/y in the dry van market. Reefer is holding up best, only down 8%-9% y/y, and flatbed has been hit hardest, off 18%-19% right now vs a year ago. We expect the spot market to bottom out soon, but the rebound in rates, as discussed above, will depend on the strength of the recovery coupled with the pinch of industry supply.
Chart 11 – TL spot rates went into free fall in April and have yet to find a bottom in dry van or flatbed
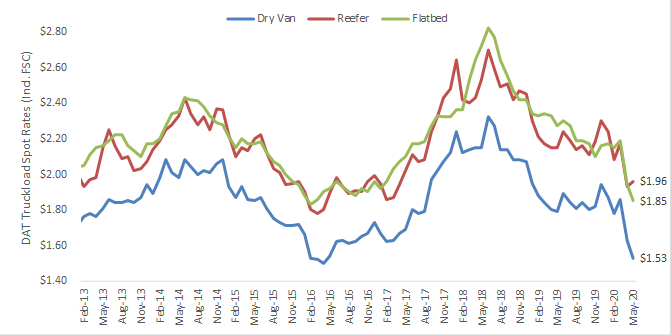
Source: DAT Solutions, through week ended 5/10/20
The Cass Intermodal Price Index (Chart 12), measuring total per-mile costs, looks at the smaller intermodal market and shows a very similar trend to what we’ve seen in TL, falling 7.1% y/y in April. With intermodal volume comps improving through April and into May (Chart 14), we would think this is a bottom on the Cass Intermodal Price Index. When TL rates strengthen, intermodal rates should rise again.
In summary, we believe the Cass Intermodal Price Index has bottomed for this cycle in April, and the relative strength of May and June readings (which should still be down y/y) will depend on how the re-opening of the economy plays out.
Chart 12 – The Cass Intermodal Price Index fell again in April with softer volumes
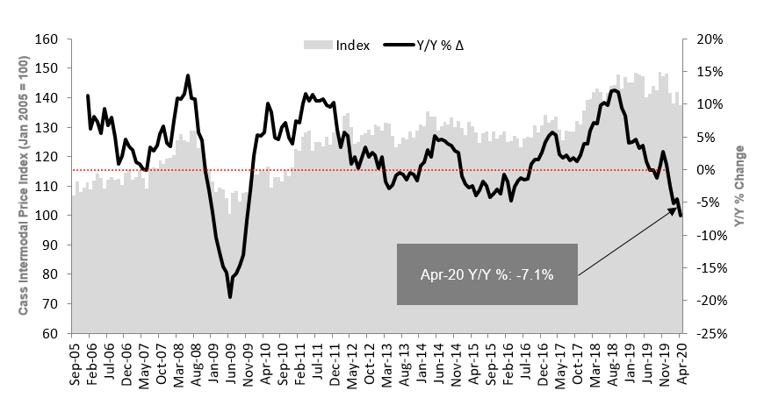
Source: Cass Information Systems, Inc. and Stifel research
Chart 13 – Cass Intermodal Price Index

To activate the data download feature, double click within the chart area and then select the download icon.
Chart 14 – But those intermodal volume comps bottomed early April, so the worst is likely over
Source: Association of American Railroads
Note: All historical truckload and intermodal data was restated in November 2019, with an extremely high correlation to the previous data.