Cass Transportation Index Report October 2022

Get the most up-to-date data and insights into shipping volumes and the cost of freight. See how they change each month and understand the market forces behind them.

SubscribeDownload Historical Data Points (xls)

Your Chip Has Come In

  October  2022 Year-over-year change 2-year stacked change Month-to-month change Month-to-month change (SA*)
Cass Freight Index - Shipments 1.224 2.9% 3.7% -1.4% 0.3%
Cass Freight Index - Expenditures 4.399 11.1% 52.4% -4.9% -4.0%
Cass Inferred Freight Rates 3.594 7.9% NA -3.6% -4.3%
Truckload Linehaul Index 153.9 2.0% 14.4% -1.5% --


* SA = seasonally adjusted

Cass Freight Index - Shipments

The shipments component of the Cass Freight Index® fell 1.4% m/m in October (+0.3% SA).

  • On a y/y basis, the index rose 2.9%, decelerated from 4.8% in September.
    After a soft 1H’22, with freight demand hit by inflation, substitution from goods back to services, and now excess inventory, the improvement in the past few months is still a little puzzling. It likely reflects a combination of:
    • unique comparisons
    • inventory building ahead of the holidays
    • repositioning of mistimed inventory
    • consumers getting ahead of rising interest rates
    • easing supply constraints, particularly in auto production

These are all temporary to varying degrees, and quickly declining import trends suggest they may end soon.

Normal seasonality from here would have shipments slowing to flat y/y in November, down 5% y/y in December, and about flat for the year.


Shipments Oct22


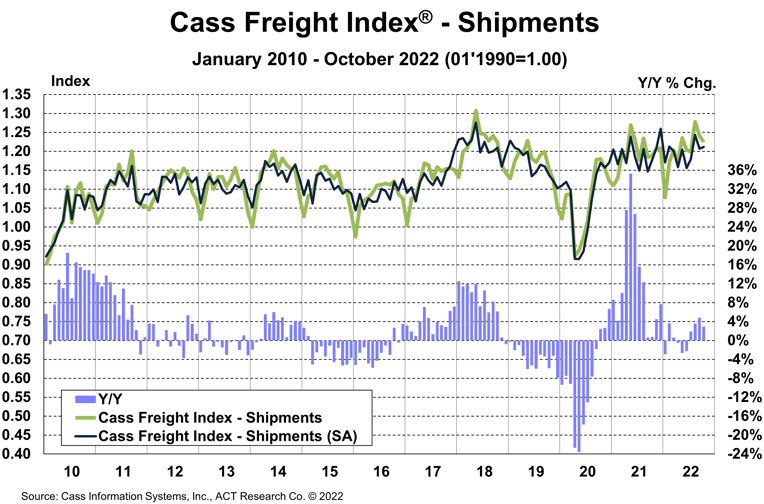
See the methodology for the Cass Freight Index.


Cass Freight Index - Expenditures

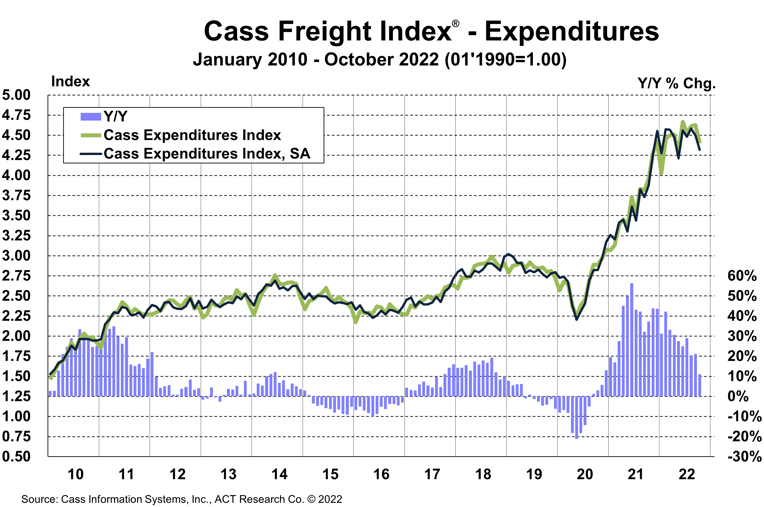
The expenditures component of the Cass Freight Index, which measures the total amount spent on freight, fell 4.9% in October after a 0.3% m/m increase in September. Against a shipment decline of 1.4% m/m in October, we can infer that rates overall were down 3.6% (see our inferred rates data series below). The increase in rates m/m appears mainly due to mix changes and seasonality. 

  • The expenditures index slowed to an 11% y/y increase in October from 21% in September.
  • On an SA basis, expenditures fell 4.0% m/m in October, with shipments up 0.3% m/m and rates down 4.3%.  

This index includes changes in fuel, modal mix, intramodal mix, and accessorial charges. 

Following normal seasonality from here, this index is now likely to turn down on a y/y basis in December.


Cass Expenditures Oct22


Inferred Freight Rates

The freight rates embedded in the two components of the Cass Freight Index slowed to 7.9% y/y growth in October, from 16% y/y growth in September.

  • Cass Inferred Freight Rates™ fell 3.6% m/m (-4.3% SA) in October. After considerable noise from fuel prices, which remain elevated, and modal mix, we see the decline as the result of the looser freight market supply/demand balance, and a downturn is nearing on a y/y basis.

The supply/demand balance in U.S. trucking markets has loosened significantly this year, and as a result freight rates are leveling off and set to soften further in the months to come.

The normal seasonal pattern would have this index up just 1% in November, and with considerable declines beginning in truckload contract rates, the negative inflection in freight costs may well happen this coming month.  

While shippers aren’t seeing any real savings yet, considerable cost relief is now highly probable for 2023, which we think will be welcome news for the broader inflation picture.


Inferred Rates Oct22


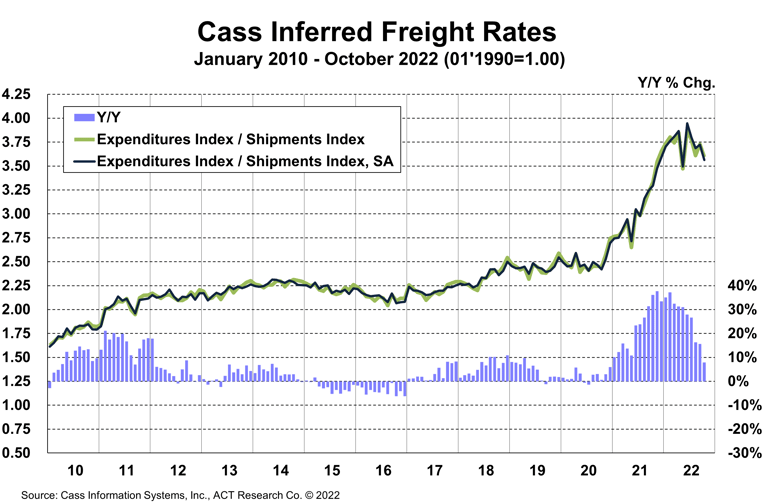
Cass Inferred Freight Rates are a simple calculation of the Cass Freight Index dataexpenditures divided by shipmentsproducing a data set that explains the overall movement in cost per shipment. The data set is diversified among all modes, with truckload representing more than half of the dollars, followed by LTL, rail, parcel, and so on.


Download the data

Truckload Linehaul Index

The Cass Truckload Linehaul Index®, which measures changes in truckload linehaul rates, slowed to a 2.0% y/y increase in October after rising 3.9% y/y in September.

  • On a m/m basis, the Cass Truckload Linehaul Index fell 1.5% after a 2.2% decline in September.
  • As a broad market indicator, this index includes both spot and contract freight, and with spot rates already down significantly, it’s only a matter of time until the index begins to decline on a y/y basis (December isn’t out of the question).  
  • Similar to what has occurred in the spot market, the recent resurgence of fuel costs, which are excluded from this index, will also likely act as a brake on linehaul rates. 


Cass Truckload Linehaul Index Oct22


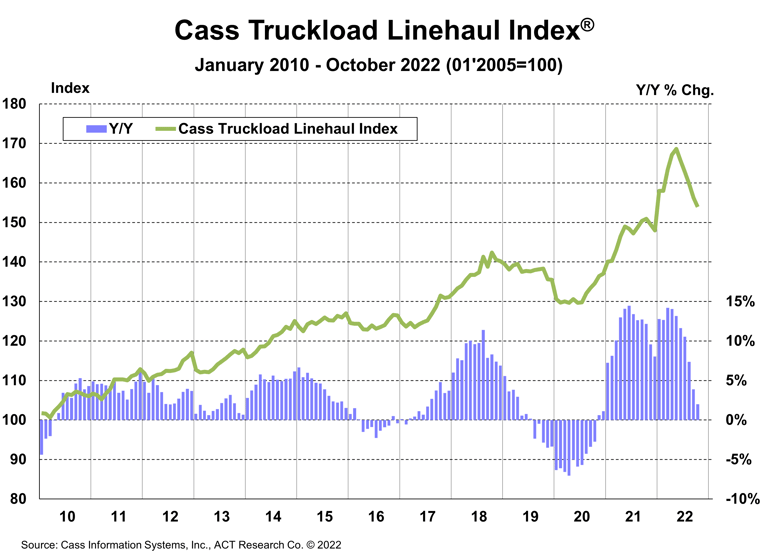
See the methodology for the Cass Truckload Linehaul Index.


Freight Expectations

We would still describe the freight market as soft, with much of the recent strength on a y/y basis more statistical noise than signal, as evidenced by the 5% y/y decline in shipments that will take place in December if normal seasonality plays out from here.

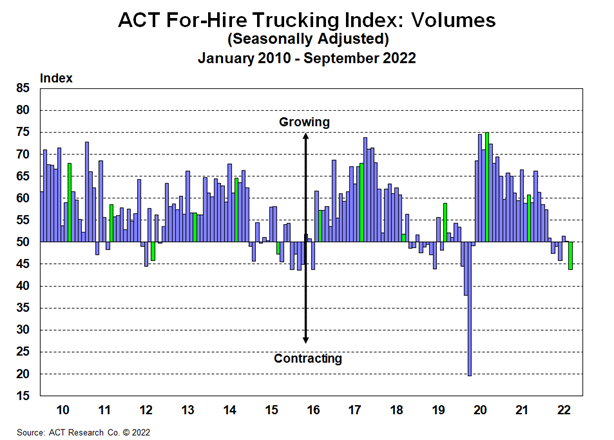
To highlight the growing contrast between data sets as the economy slows, the ACT For-Hire Volume Index, a survey-based sentiment indicator, recently registered a new cycle low. So, it feels a lot softer to the industry than the Cass data suggest, but the bridge between the two is supply. It doesn’t feel like a good environment because there is more supply chasing a similar amount of freight. And it is this imbalance that is allowing freight costs to begin to come down.


ACT For-Hire Trucking Index Oct 2022


Now that the pendulum is swinging, some crucial questions about the freight rate cycle have been raised: How long? And when will it turn? The ACT Research Freight Forecast report provides monthly, quarterly, and annual predictions for the truckload (TL), less-than-truckload (LTL), and intermodal markets through 2024, including capacity, volumes, and rates. The report provides monthly updates of forecasts for the shipments component of the Cass Freight Index and the Cass Truckload Linehaul Index, as well as DAT spot rates by trailer type, including and excluding fuel surcharges. 


Release date: We strive to release our indexes on the 12th of each month. When this falls on a Friday or weekend, our goal is to publish on the next business day.

Tim Denoyer head

About the Author: Tim Denoyer, ACT Research

Tim Denoyer joined ACT Research in 2017, after spending fifteen years in equity research focused primarily on the transportation, machinery, and automotive industries. Tim is a senior analyst leading ACT’s team transportation research effort, and the primary author of the ACT Freight Forecast, U.S. Rate and Volume Outlook. Research associate Carter Vieth, who joined ACT in early 2020 after graduating from Indiana University, also contributes to the report. This report provides supply chain professionals with better visibility on the future of pricing and volume in trucking, the core of the $1.06 trillion U.S. freight transportation industry, including truckload, less-than-truckload, and intermodal.

Tim also plays roles in ACT Research’s core Class 4-8 commercial vehicle data analysis and forecasting, in powertrain development, such as electrification analysis, and in used truck valuation and forecasting. Tim has supported or led numerous project-based market studies on behalf of clients in his four years with ACT Research on topics ranging from upcoming emissions and environmental regulations to alternative powertrain cost analyses to e-commerce and last-mile logistics to autonomous freight market sizing.

ACT’s freight research service leverages ACT’s expertise in the supply side economics of transportation and draws upon Tim’s background as an investment analyst, beginning at Prudential and Bear Stearns. Tim was a co-founder of Wolfe Research, one of the leading equity research firms in the investment industry. While with Wolfe, Tim was recognized in Institutional Investor’s survey of investors as a Rising Star analyst in both the machinery and auto sectors. His experience also includes responsibility for covering the industrial sector of the global equity markets, including with leading investment management company Balyasny Asset Management.

Disclaimer

The material contained herein is intended as general industry commentary. The Cass Freight Index, Cass Truckload Linehaul Index (“Indexes”), and other content are based upon information that we consider reliable, but Cass does not guarantee the accuracy, timeliness, reliability, continued availability or completeness of any information or underlying assumptions, and Cass shall have no liability for any errors, omissions or interruptions. Any data on past performance contained in the Indexes is no guarantee as to future performance. The Indexes and other content are not intended to predict actual results, and no assurances are given with respect thereto. Cass makes no warranty, express or implied. Opinions expressed herein as to the Indexes are those of Stifel and may differ from those of Cass Information Systems Inc. All opinions and estimates are given as of the date hereof and are subject to change.

Receive Index updates straight to your inbox