

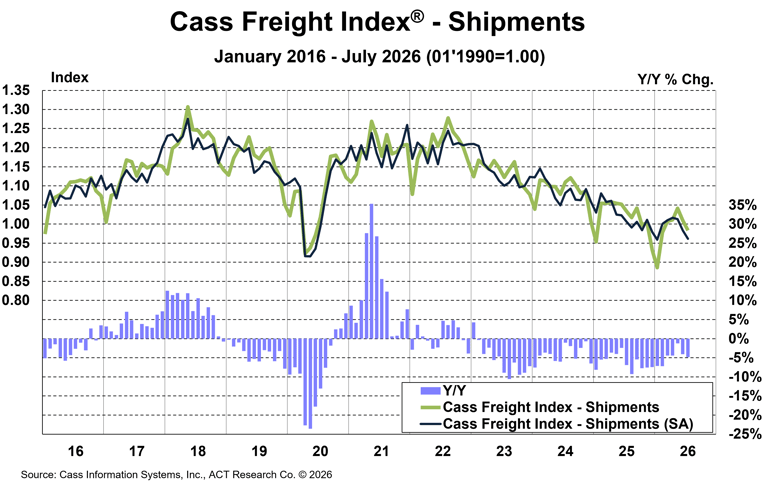
The shipments component of the Cass Freight Index fell 4.8% y/y in July, after a 4.1% drop in June.
In seasonally adjusted (SA) terms, shipments fell 2.2% m/m in July, after a 2.9% drop in June.
Some of the softness is the result of higher fuel prices, but to a large extent, volumes are still soft because capacity is declining. The Cass data are trucking intensive, among other modes, but rail intermodal is gaining share from trucking this year, also pressuring this index.
The normal seasonal trend would put the shipments component of the Cass Freight Index down about 3% y/y in August.
See the Methodology for the Cass Freight Index
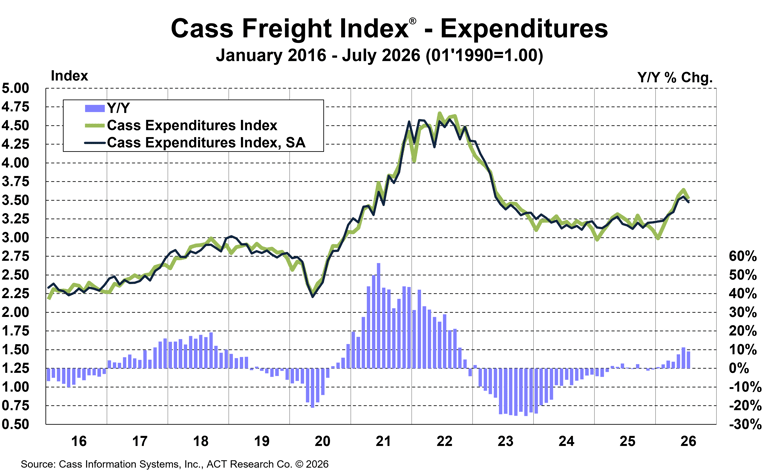
The expenditures component of the Cass Freight Index, which measures the total amount spent on freight, rose 9.1% y/y in July to 3.52, slowing from an 11.2% gain in June. The slowdown was mainly due to lower volumes.
In SA terms, the index fell 2.2% m/m after rising for eight straight months, on a 2.2% drop in shipments and a slight increase in rates.
The expenditures component of the Cass Freight Index, after a record 38% surge in 2021 and another 23% increase in 2022, fell 19% in 2023 and 11% in 2024. In 2025, the index declined by 0.5%.
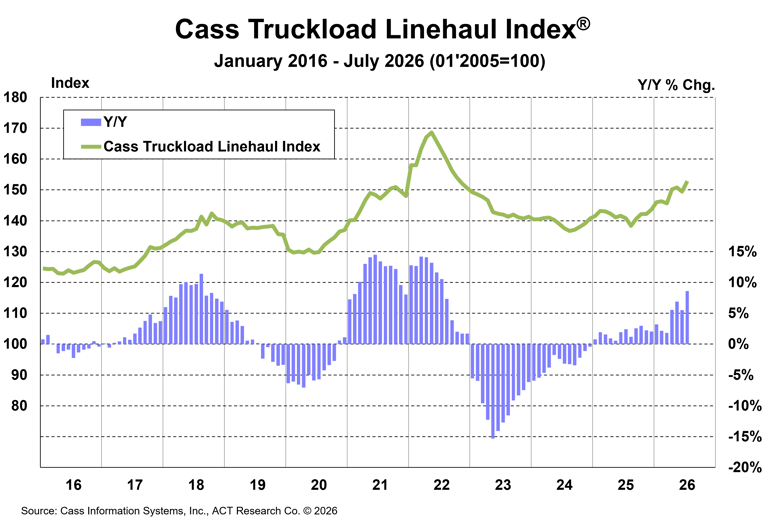
The Cass Truckload Linehaul Index rose to 152.9 in July, up 2.3% m/m and up 8.6% y/y.
After a surprising 0.9% y/y decline in June, the sequential increase is greater than normal, and considering spot activity, further increases should be expected.
These shipper-sourced rates are not taking off like some leading spot indicators, but should provide a perspective consistent with the broader truckload market, which is still mostly contract. In Q2, we (ACT Research) estimate similar rates at the publicly traded truckload fleets rose 8.7% y/y.
This index reflects the whole for-hire truckload market, both spot and contract rates.
The Cass Truckload Linehaul Index fell 10% in 2023, another 3.4% in 2024, and turned up to a 1.8% increase in 2025.
See the Methodology for the Cass Truckload Linehaul Index

The supply-led rate recovery continues, and with interest rates rising and fuel prices remaining elevated, the demand outlook remains under pressure. Class 8 tractor sales are set to rise above replacement levels in the coming months, alleviating one constraint on the market. But real income growth has slowed to almost zero and savings rates are worryingly low, so it seems like we might have to keep waiting for Godot.
Need more freight market intelligence? The ACT Research Freight Forecast comprehensively covers TL, LTL, and intermodal volumes and rates, with the best quality data sets in the industry. ACT Research forecasts through 2028 are detailed in the Freight Forecast report.
This service provides in-depth analysis and forecasts for a broad range of U.S. freight measures, including the Cass Freight Index, Cass Truckload Linehaul Index, and DAT spot and contract rates by trailer type, with and without fuel. We provide monthly, quarterly, and annual predictions over a two- to three-year time horizon, including capacity, volumes, and rates. The ACT Research Freight Forecast is released monthly in conjunction with the Cass Transportation Index report.
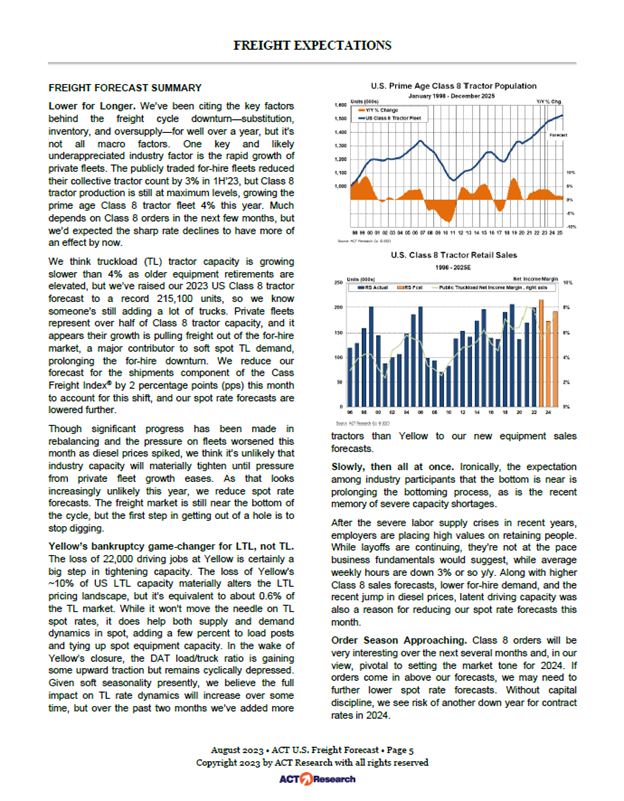
For a sense of forecast accuracy, please see this one-page monthly summary, from mid-2023. While these dynamics have reversed, we think it will help you understand why our supply-side perspective is helpful for planning, strategy, and forecasting.
(As a reminder, ACT Research’s Tim Denoyer writes this report.)
Release date: We strive to release our indexes on the 13th of each month. When this falls on a Friday or weekend, our goal is to publish on the next business day.