Cass Transportation Index Report October 2021

Get the most up-to-date data and insights into shipping volumes and the cost of freight. See how they change each month and understand the market forces behind them.

SubscribeDownload Historical Data Points (xls)

Light at the End of the Tunnel?

  October 2021 Year-over-year change 2-year stacked change Month-to-month change Month-to-month change (SA)
Cass Freight Index - Shipments 1.189 0.8% 3.2% .4% 2.8%
Cass Freight Index - Expenditures 3.960 37.2% 41.4% 3.7% 3.9%
Truckload Linehaul Index 150.9 12.2% 9.1% 0.3% 0.3%


Cass Freight Index - Shipments

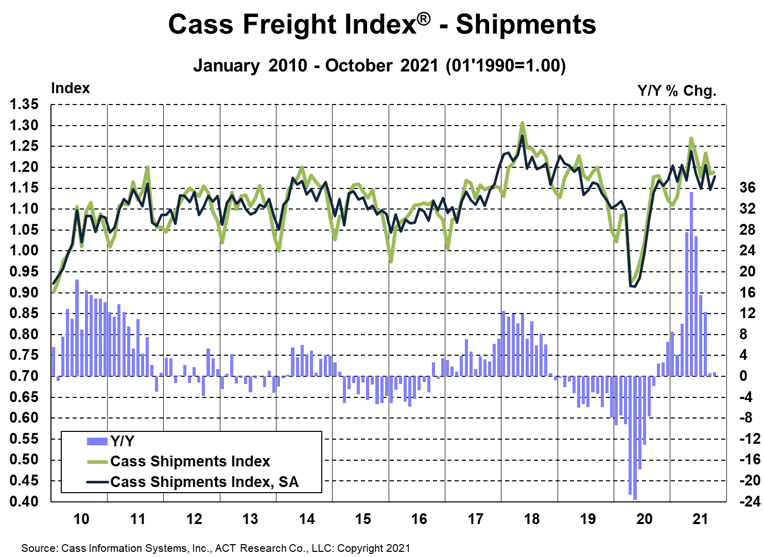
The shipments component of the Cass Freight Index® was 0.8% higher than the year-ago level in October, similar to the 0.6% y/y increase in September.

  • On a seasonally adjusted (SA) basis, our shipments index recovered 2.8% m/m in October, after falling 4.9% m/m in September, partly due to Hurricane Ida.
  • The two-year stack reversed to a 3.2% increase from a 1.3% drop in September.

Freight volumes remain capacity-constrained, as shown by declining rail volumes and the ongoing backlog of containerships at anchor waiting to unload, but the 2.9% m/m improvement shows a modest rebound as restocking demand remained elevated. A pickup in automotive volumes likely also helped, as October rail carloadings in the motor vehicle category rose about 15% m/m.


Cass shipments October 2021

See the methodology for the Cass Freight Index.


To access forecasts of the shipments component of the Cass Freight Index® and the Cass Truckload Linehaul Index® through 2023, subscribe to the ACT Research Freight Forecast report.


Cass Freight Index - Expenditures

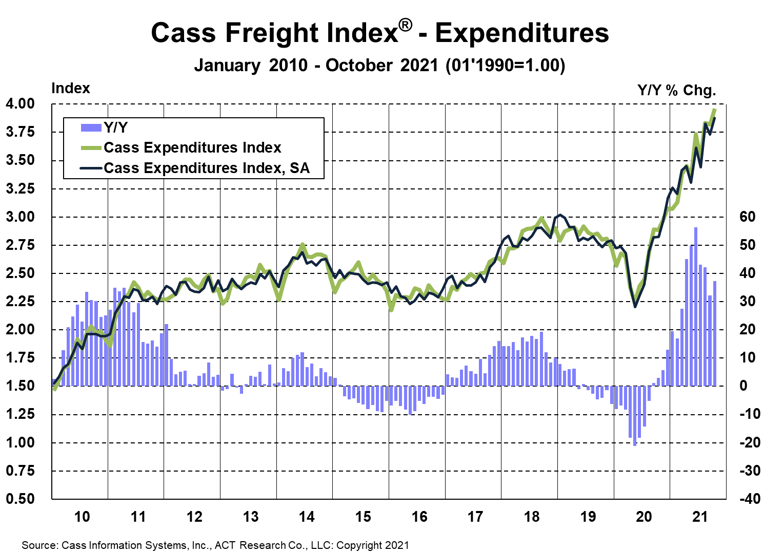
The expenditures component of the Cass Freight Index, which measures the total amount spent on freight, rose to a new record level of 3.96, up 37% y/y in October. This index reaccelerated from 32% growth in September despite a slightly tougher prior-year comparison.

  • On an SA basis, expenditures rose 3.9% m/m in October, mostly due to higher shipment volumes, and to a lesser degree from higher rates.
  • On a two-year stacked basis, the Cass expenditures index was up 41% in October, mostly explained by higher rates, as shipment volumes were up just 3.2% on this basis.

If normal seasonality were to play out for the rest of this year, the full-year increase in this index would be 34% in 2021, after a 7% decline in 2020 and no change in 2019.

Tougher comparisons in the coming months will naturally slow these y/y increases further, but normal seasonality implies double-digit increases through most of the first half of 2022.


Cass expenditures October 2021


Inferred Freight Rates

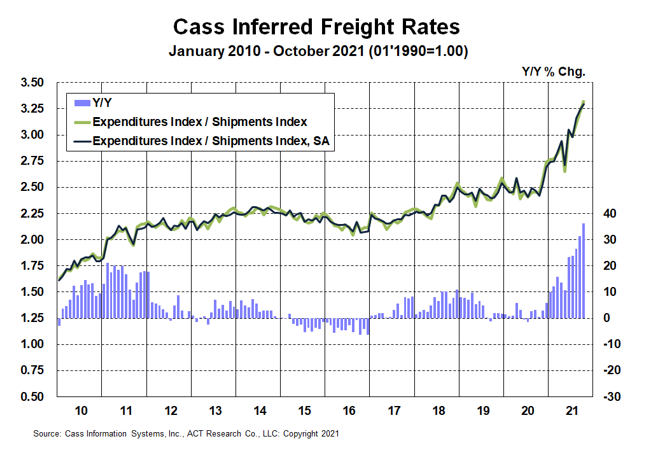
A simple calculation of the Cass Freight Index data (expenditures divided by shipments) produces a data set of inferred freight rates that explains the overall movement in rates.

  • The freight rates embedded in the two components of the Cass Freight Index were 36% higher y/y in October, accelerated from the 31% y/y increase in September, partly on an easier comparison.
  • The inferred rates rose 1.6% m/m on a seasonally adjusted basis in October in the third straight m/m increase.

Though difficult to quantify, there are a lot of excess miles in the system due to all of the supply chain disruptions in the shortage economy of 2021. Chassis production improved this month but remains far from what is needed to address rail network congestion, so West Coast imports continue onto truckload, considerably raising the length of haul in the largest freight market.

These excess miles are part of the 36% y/y increase in inferred freight rates, because, as noted in the calculation above, these rates are on a per shipment basis, rather than a per mile basis. But the difference between the increase in overall inferred freight rates and the Cass Truckload Linehaul Index® also includes higher fuel surcharges (not included in the TL index), sharper increases in air cargo rates, and mix shifts between modes, with a smaller proportion of low-cost intermodal and rail, and a larger proportion of relatively higher-cost air and refrigerated truckload.

For full-year 2021, if normal seasonality were to play out, this index would be up about 20% from 2020. The data set is diversified among all modes, with truckload representing more than half of the dollars, followed by LTL, rail, parcel, and so on.


Cass inferred rates Oct 2021

 Download the data

Truckload Linehaul Index

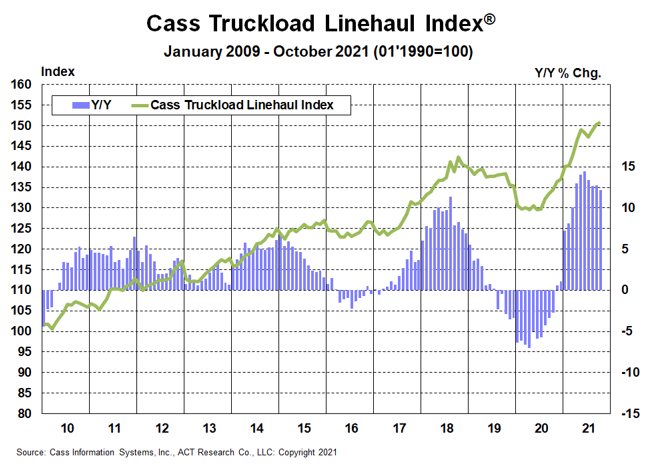
The Cass Truckload Linehaul Index® value of 150.9 in October rose 0.3% from September, and rose 12.2% y/y, similar to the 12.7% increase in September.

With upward pressure from chip shortages and upcoming vaccine mandates which could slow the driver recovery and push freight into the for-hire spot market, this index is still projected to trend higher. This data series trending below the 22% increase in Q3 public TL fleet rates is due to longer-haul mix. The large public fleets, by contrast, have been opting for shorter-haul shipments with better returns.

Longer-haul mix related to intermodal chassis shortages pushing more freight off the rails and into truckload markets, particularly from the West Coast to Midwest, is continuing to pressure these data. While temp-controlled length of haul is up a little, dry van length of haul is up meaningfully. We estimate this reduced the Cass Truckload Linehaul Index by roughly 7%-8% this month, so the mileage-neutral truckload rate is probably up about 20% y/y.

Freight demand is clearly still strong and persistent supply constraints are keeping upward pressure on rates. The gradual easing of supply constraints for critical components of trucking capacity – drivers and equipment – will continue to be key to the longer-term outlook. This should change the trajectory of the Cass Truckload Linehaul Index over the next year, but not quite yet.


Cass Truckload Linehaul Index Oct 2021

See the methodology for the Cass Truckload Linehaul Index.


Freight Expectations

The current supply chain issues are building pent-up demand, and a broad range of freight demand fundamentals remain supportive, suggesting a positive demand environment will continue well into next year.

Though the near-term direction of freight rates remains higher, cyclical forces like driver hiring and wafer fab construction, which take time, are diligently occurring in the background and will dictate the direction of capacity, volume, and rate trends in 2022.

  • Equipment. The heavy-duty truck production outlook continues to be pressured mightily by semiconductor shortages. However, global semiconductor shipments accelerated to 16% y/y growth in Q3, in a signal that perhaps the worst of the chip shortage is behind us. Chassis production improved in recent months to at least stop the contraction of the chassis fleet, but much more needs to be done to improve intermodal network performance. Trailer supply chains also face labor constraints.
  • Drivers. In the strongest report this year, the October jobs report featured 15,300 total trucking job additions, including revisions, as hiring trends continue the improving trend of the past five months, ever since extended unemployment curtailments began.

Though the ACT Research For-Hire Driver Availability Index ticked down this month amid vaccine mandate uncertainty, the improving trend should continue as mandates are delayed in court and most of the trucking industry is effectively exempted. For more detail on a variety of risks related to the proposed vaccine mandate, from team drivers to private fleets to dock workers, see this month’s ACT Freight Forecast report.

This report also forecasts the shipments component of the Cass Freight Index® and the Cass Truckload Linehaul Index® through 2023.

Rail volumes Oct 2021


Release date: We strive to release our indexes on the 12th of each month. When this falls on a Friday or weekend, our goal is to publish on the next business day.

Tim Denoyer head

About the Author: Tim Denoyer, ACT Research

Tim Denoyer joined ACT Research in 2017, after spending fifteen years in equity research focused primarily on the transportation, machinery, and automotive industries. Tim is a senior analyst leading ACT’s team transportation research effort, and the primary author of the ACT Freight Forecast, U.S. Rate and Volume Outlook. Research associate Carter Vieth, who joined ACT in early 2020 after graduating from Indiana University, also contributes to the report. This report provides supply chain professionals with better visibility on the future of pricing and volume in trucking, the core of the $800 billion U.S. freight transportation industry, including truckload, less-than-truckload, and intermodal.

Tim also plays roles in ACT Research’s core Class 4-8 commercial vehicle data analysis and forecasting, in powertrain development, such as electrification analysis, and in used truck valuation and forecasting. Tim has supported or led numerous project-based market studies on behalf of clients in his four years with ACT Research on topics ranging from upcoming emissions and environmental regulations to alternative powertrain cost analyses to e-commerce and last-mile logistics to autonomous freight market sizing.

ACT’s freight research service leverages ACT’s expertise in the supply side economics of transportation and draws upon Tim’s background as an investment analyst, beginning at Prudential and Bear Stearns. Tim was a co-founder of Wolfe Research, one of the leading equity research firms in the investment industry. While with Wolfe, Tim was recognized in Institutional Investor’s survey of investors as a Rising Star analyst in both the machinery and auto sectors. His experience also includes responsibility for covering the industrial sector of the global equity markets, including with leading investment management company Balyasny Asset Management.

Disclaimer

The material contained herein is intended as general industry commentary. The Cass Freight Index, Cass Truckload Linehaul Index (“Indexes”), and other content are based upon information that we consider reliable, but Cass does not guarantee the accuracy, timeliness, reliability, continued availability or completeness of any information or underlying assumptions, and Cass shall have no liability for any errors, omissions or interruptions. Any data on past performance contained in the Indexes is no guarantee as to future performance. The Indexes and other content are not intended to predict actual results, and no assurances are given with respect thereto. Cass makes no warranty, express or implied. Opinions expressed herein as to the Indexes are those of Stifel and may differ from those of Cass Information Systems Inc. All opinions and estimates are given as of the date hereof and are subject to change.

Receive Index updates straight to your inbox