The shipments component of the Cass Freight Index® fell 0.4% y/y in November. On a m/m basis, the index fell 1.9%, or 0.5% on a seasonally adjusted (SA) basis.
Sharpening declines in imports, into the West Coast in particular, suggest near-term trends could soften further. Normal seasonality from here would have shipments down 5% y/y in December and about flat for the year.
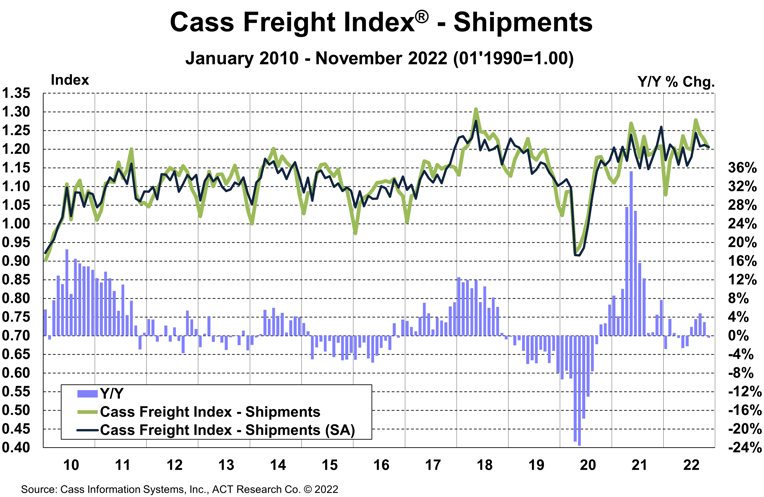
See the methodology for the Cass Freight Index.
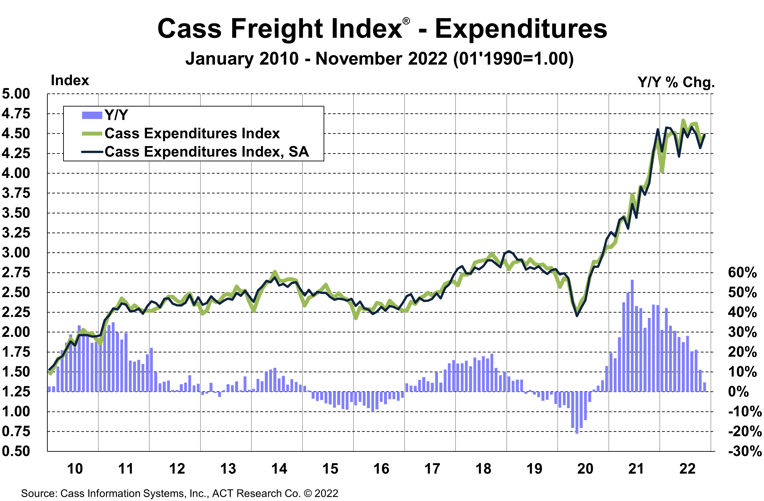
The expenditures component of the Cass Freight Index, which measures the total amount spent on freight, rose 4.7% y/y in November, slowing from an 11.1% increase in October.
Expenditures rose 1.8% m/m after a 4.9% drop in October. Against a shipment decline of 1.9% m/m in November, we can infer that rates overall were up 3.7% (see our inferred rates data series below). The increase in rates m/m appears mainly due to changes in modal mix.
This index includes changes in fuel, modal mix, intramodal mix, and accessorial charges, so is a bit more volatile than the cleaner Cass Truckload Linehaul Index®.
Following normal seasonality from here, this index is now likely to be flattish on a y/y basis in December and end the year with a 23% increase.
The slowdown in freight rates continued this month, with the rates embedded in the two components of the Cass Freight Index® slowing to 5.1% y/y growth in November, from 7.9% y/y growth in October.
The supply/demand balance in U.S. trucking markets has loosened significantly this year, and as a result freight rates are leveling off and set to soften further in the months to come.
The normal seasonal pattern would have this index turning down on a y/y basis in February 2023, but it could happen sooner given market conditions.
Shippers are starting to see real savings and considerable cost relief is now likely for 2023, which should be increasingly positive news for the complex inflation picture.
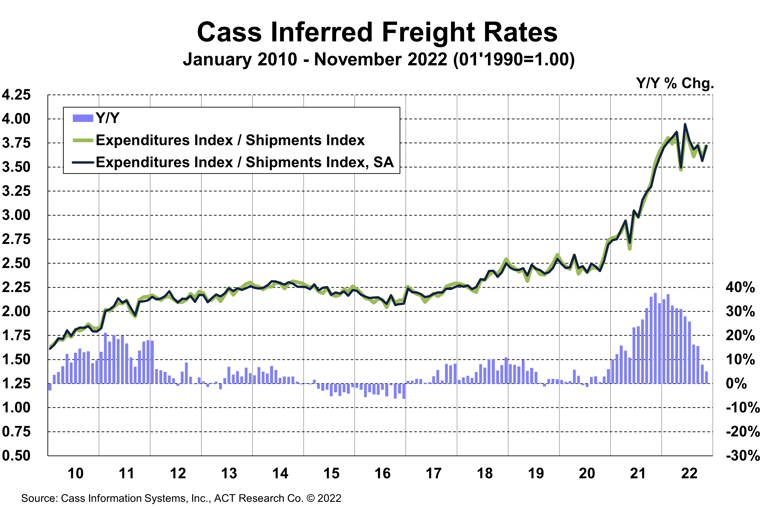
Cass Inferred Freight Rates are a simple calculation of the Cass Freight Index data—expenditures divided by shipments—producing a data set that explains the overall movement in cost per shipment. The data set is diversified among all modes, with truckload representing more than half of the dollars, followed by LTL, rail, parcel, and so on.
The downtrend in truckload linehaul rates completed its sixth month in November, as the Cass Truckload Linehaul Index slowed to a 1.7% y/y increase from 2.0% in October.
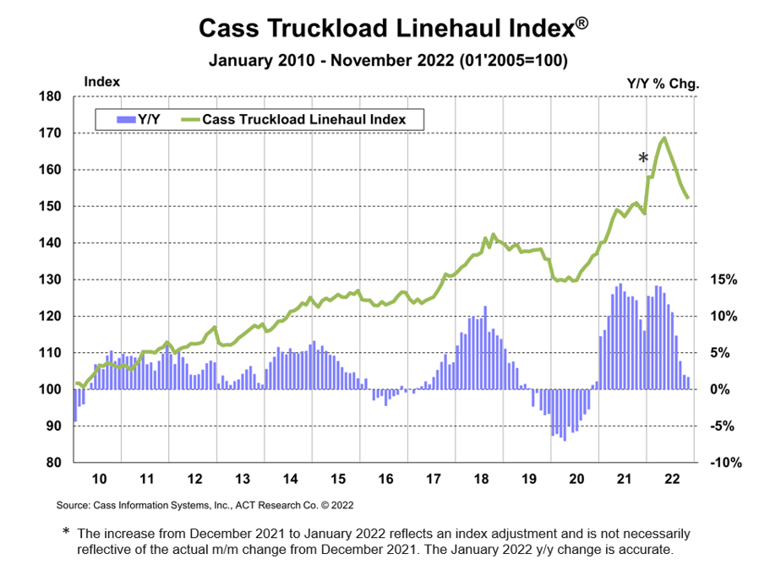
See the methodology for the Cass Truckload Linehaul Index.
To mix it up from our usual freight market discussion in this last month of the year, we’d like to address a question that arose after Tesla recently announced its first 500-mile journey in a Semi electric tractor with an 81,000-lb. load.
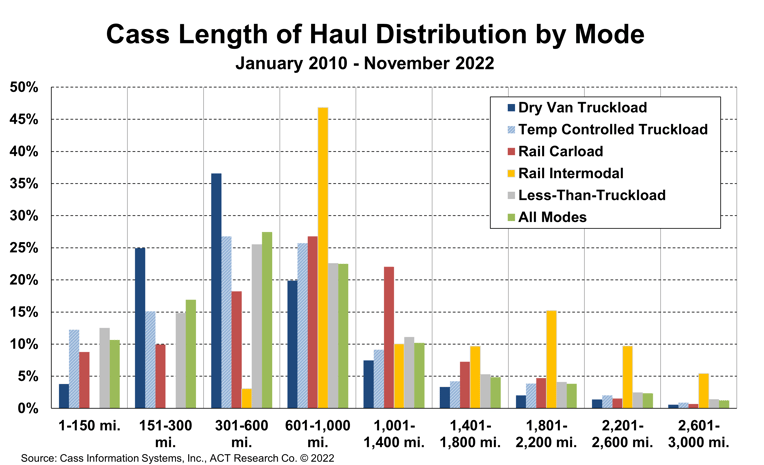
We broke down the Cass database by mode and mileage to see specifically what proportion of shipments in each mode fall into each mileage bucket, and the results are below. While we’d of course love smaller buckets, the chart below represents an excellent sample of about 120 million shipments.
In the dry van truckload market, the heart of the industry where the Semi is targeted, about 47% of shipments are under a 450-mile length of haul. Just 4% of shipments are under 150 miles, and another 25% are under 300 miles. We have to slice our 301-600 mile bucket to answer the question, and we’ll err on the side of caution considering the 500-mile range seems more like a stretch than a normal operation and take half of that 37% bucket. Adding it up, about 47% of dry van shipments are likely addressable by the Semi.
In the reefer, or temp-controlled, truckload market, about 40% of shipments are under a 450-mile length of haul. A larger share, 12% of shipments are under 150 miles and 15% are 150-300 miles. But with more long-haul, we estimate using the same logic as above that 41% of the reefer market is under 450-miles, and with refrigeration energy to account for, a lower threshold is appropriate, though the reefer unit makers have creative ways to support electrification as well. About 40% of LTL is under the 450-mile threshold as well.
We expect the more local shipments, like snacks and drinks, to be the first to electrify, and even though payback periods for EVs have fallen this year as diesel prices surge and inventories remain fairly tight, the overall economics haven’t improved much because of higher electricity and battery costs, though the $40k per unit incentive in the Inflation Reduction Act helps.
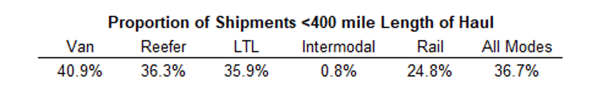
If we take a fleet manager’s perspective, the need for a larger safety buffer would suggest the vehicle should only go into shorter applications for a while. But if we take the buffer to 20% and ask the database what proportion of shipments are less than a 400-mile length of haul, we find about 37%. How many shipments does that mean every year in the U.S.? That’s not one anyone can answer with any precision, but our best guess is around 150 million shipments.
Now that the pendulum has swung from fleets to shippers, some crucial questions about the freight rate cycle have been raised: How long? And when will it turn? The ACT Research Freight Forecast report provides monthly, quarterly, and annual predictions for the truckload (TL), less-than-truckload (LTL), and intermodal markets through 2024, including capacity, volumes, and rates. The report provides monthly updates of forecasts for the shipments component of the Cass Freight Index and the Cass Truckload Linehaul Index, as well as DAT spot rates by trailer type, including and excluding fuel surcharges.
Release date: We strive to release our indexes on the 12th of each month. When this falls on a Friday or weekend, our goal is to publish on the next business day.

