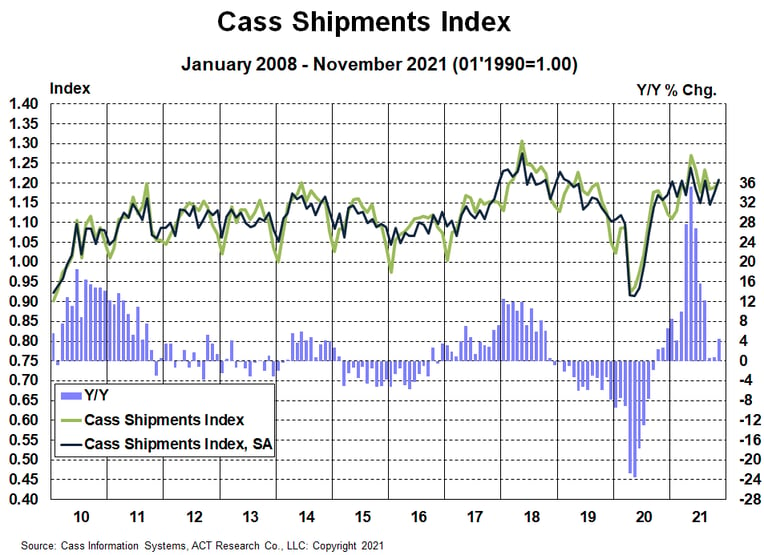
The shipments component of the Cass Freight Index® was 4.5% higher than the year-ago level in November, accelerating from a 0.8% y/y increase in October.
On a seasonally adjusted (SA) basis, the shipments index rebounded 2.6% m/m in November, after a 2.9% m/m increase in October, now more than recovering from the weather-impacted September data.
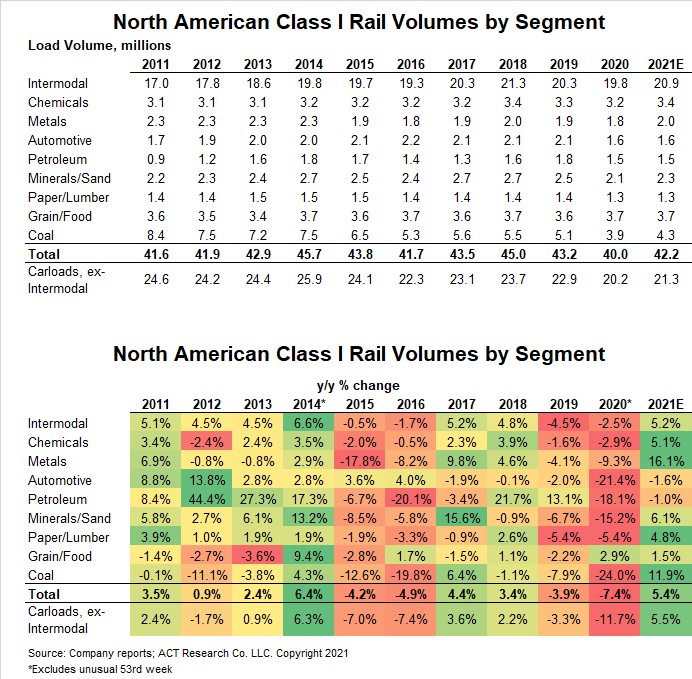
Freight volumes remain capacity-constrained, as shown by declining rail volumes and the ongoing backlog of containerships outside of U.S. ports. Although little progress has been made on the ocean as of yet, the pickup in our shipments index shows progress as the freight industry works to de-bottleneck. One important example of this is recent easing in semiconductor shortages, as shown by improving automotive rail carloadings.
If you are interested in where North American freight volumes are headed, ACT Research forecasts our shipments index (as well as our Truckload Linehaul Index) in its monthly report. Their forecast for this month was +4.2%, closely in line with the actualized +4.5%.
See the methodology for the Cass Freight Index.
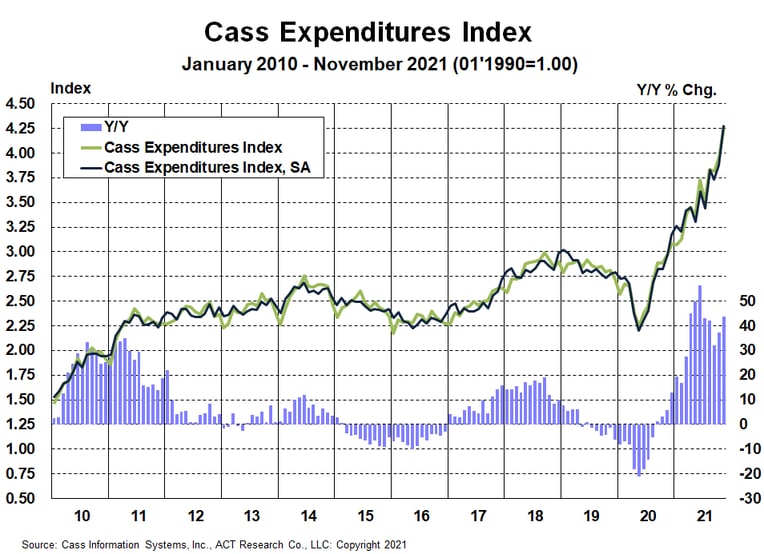
The expenditures component of the Cass Freight Index, which measures the total amount spent on freight, rose to a new record level of 4.275, up 44% y/y in November and 8.0% m/m.
The full-year increase in this index will be 37% in 2021 assuming normal seasonality in December, after a 7% decline in 2020 and no change in 2019.
Tougher comparisons in the coming months will naturally slow these y/y increases, but again, just using normal seasonality from here, the increase in 2022 will still be 18%-20% at this trend level.
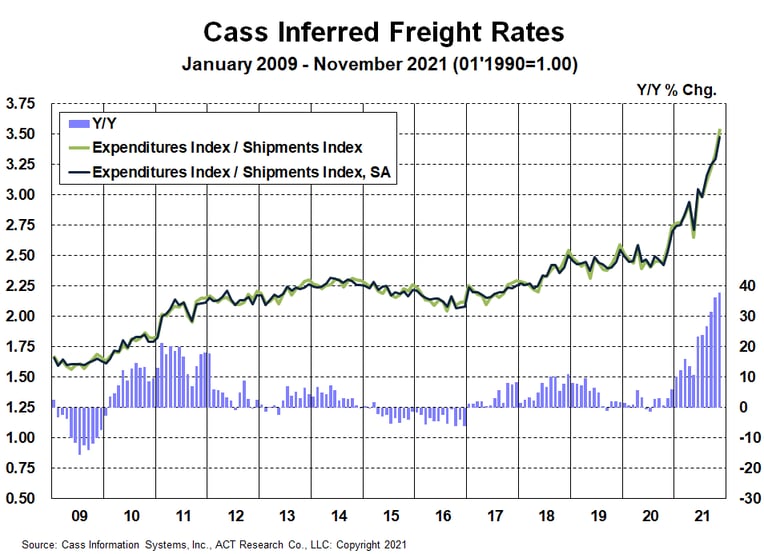
A simple calculation of the Cass Freight Index data (expenditures divided by shipments) produces a data set of inferred freight rates that explains the overall movement in cost per shipment.
Significant excess miles are continuing in the freight network due to myriad supply chain disruptions in the shortage economy of 2021. Chassis production has improved significantly in the past two months, but the chassis fleet remains far from what is needed to address rail network congestion, so imports continue onto truckload, particularly off the West Coast, considerably raising the length of haul as trucking continues to take share from a snarled rail network.
These excess miles are a significant part of the 38% y/y increase in inferred freight rates, because, as noted in the calculation above, these rates are on a per shipment basis, rather than a per mile basis. Higher fuel surcharges are part of the increases, as are modal mix, accessorial fees, and significantly longer lengths of haul due to intermodal service issues. These freight cost factors are not reflected in the Cass Truckload Linehaul Index, which is strictly the linehaul rate only.
For full-year 2021, Cass inferred freight rates are trending up about 23% from 2020 and are heading into 2022 up even more than that on a y/y basis. The data set is diversified among all modes, with truckload representing more than half of the dollars, followed by LTL, rail, parcel, and so on.
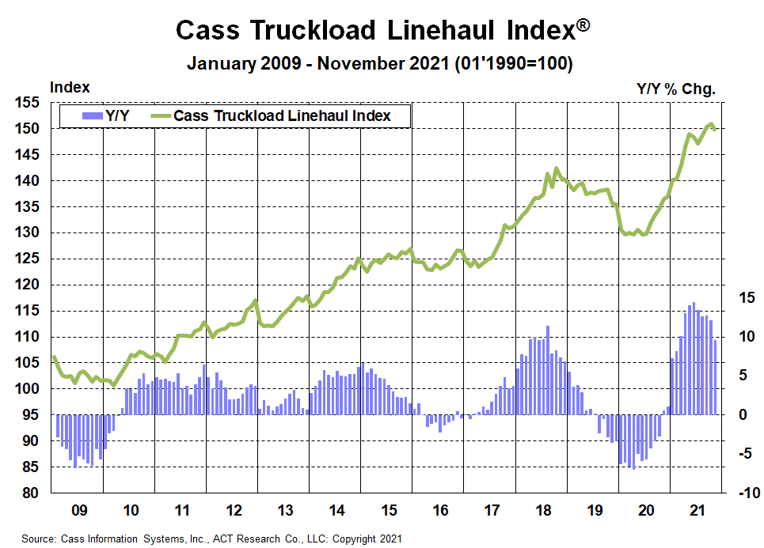
The Cass Truckload Linehaul Index®, which measures changes in linehaul rates, fell 1.5 points in November to 149.5 from 150.9 in October, down 0.9% m/m and up just 9.6% y/y, slower than the 12.2% increase in October. With upward pressure from strong freight demand and ongoing capacity tightness, this index is projected to continue trending higher. This data series trends below the 22% increase in public Q3 truckload fleet rates due to longer-haul highway mix resulting from rail service issues. Accessorials are also part of the difference, as those are excluded from the linehaul index, but much smaller than the mix effects from length of haul (LOH).
As has been the case for at least the past six months, the longer-haul mix related to intermodal chassis shortages pushing more freight off the rails and into truckload markets, particularly from the West Coast to Midwest, is continuing to pressure these data. We estimate this reduced the Cass Truckload Linehaul Index significantly, and a mileage-neutral truckload rate is probably up about 20% y/y.
The story is the same: freight demand is clearly still strong and persistent supply constraints are keeping upward pressure on rates. The gradual easing of supply constraints for critical components of trucking capacity – drivers and equipment – will continue to be key to the longer-term outlook. We see this changing the trajectory of the Cass Truckload Linehaul Index over the next year, but not quite yet.
See the methodology for the Cass Truckload Linehaul Index.
The freight cycle has been on the upswing for about 18 months. Fundamentals remain positive, with a strong consumer balance sheet and significant additional need for restocking.
It’s worth reminding our readers that in-depth analyses are available in the ACT Research Freight Forecast report, which includes sections on “The Classic Cycle of the U.S. Truckload Sector” and “Why Freight Cycles are Shorter than Economic Ones,” as well as new analysis of the chassis fleet. This month’s Freight Forecast focuses on how Omicron is likely to impact freight markets from both near- and long-term perspectives. In short, the report predicts very different freight markets this time next year.
Green shoots suggesting an easing in the “everything shortage” are beginning to emerge, including lower air and ocean rates, better port productivity, reduced rail network congestion, improved driver hiring, and rising auto production rates.
Though the near-term direction of freight rates remains higher, cyclical forces like driver hiring and semiconductor wafer fab construction, which take time, are diligently progressing in the background and will dictate the trajectory of capacity, volume, and rate trends in 2022 and beyond.
Release date: We strive to release our indexes on the 12th of each month. When this falls on a Friday or weekend, our goal is to publish on the next business day.

