Cass Transportation Index Report March 2022

Get the most up-to-date data and insights into shipping volumes and the cost of freight. See how they change each month and understand the market forces behind them.

SubscribeDownload Historical Data Points (xls)

Freight Recession? Not So Fast.

  March 2022 Year-over-year change 2-year stacked change Month-to-month change Month-to-month change (SA)
Cass Freight Index - Shipments 1.203 0.6% 10.7% 2.7% -1.0%
Cass Freight Index - Expenditures 4.501 33.2% 69.8% 1.1% -0.2%
Truckload Linehaul Index* 163.4 14.2% 25.7% 3.4%* 3.4%*


* Please note, if you follow our Truckload Linehaul Index closely: We fine-tuned our index methodology with our February 2022 release. When we did this, we revised our January 2022 index value from 150.2 to 158.0 (the same value as February).

Cass Freight Index - Shipments

U.S. freight volumes slowed further in March, with the shipments component of the Cass Freight Index up just 0.6% y/y, slower than the 3.6% y/y growth in February.

  • Though the shipments component of the Cass Freight Index rose 2.7% from February, this was 1.0% below the normal seasonal pattern.
  • The y/y growth in shipments slowed to 0.4% in Q1’22 from 4.3% in Q4’21 and 9.5% in Q3’21. While a few points of softness in Q1 were due to Omicron-related absenteeism, freight was slowing even before the war in Ukraine began.
  • The threat of freight recession has risen recently as services reopen, inflation presses up interest rates, and—though war-related effects are likely to be modest in the near-term—higher energy prices have an increasingly negative effect over time. We’re certainly seeing a freight slowdown and spot market correction, but in our view, it is too early to call it a freight recession.
  • Using a normal seasonal pattern from March, the shipments component would be up about 3% y/y in April and down about 3% y/y in May.


Cass Freight Index March 2022 Shipments


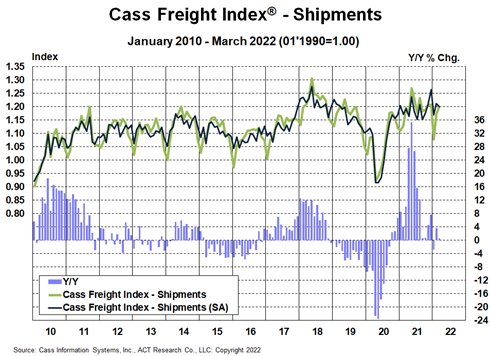
See the methodology for the Cass Freight Index.


Cass Freight Index - Expenditures

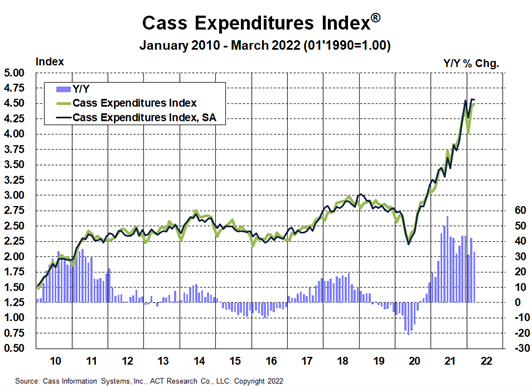
The expenditures component of the Cass Freight Index, which measures the total amount spent on freight, rose 1.1% m/m in March with shipments up 2.7% and rates down 1.6%. Year over year, freight expenditures were up 33% y/y.

  • On a seasonally adjusted basis, expenditures fell 0.2% m/m, essentially unchanged, with shipments falling 1.0% m/m and rates still creeping higher.
  • On a two-year stacked basis, the Expenditures component of the Cass Freight Index was up 70% in March, with shipments up 11% and rates up 53%.

This index rose 38% in 2021, after a 7% decline in 2020 and no change in 2019. Tougher comparisons in the coming months will naturally slow these y/y increases, but just using normal seasonality from here, the increase in 2022 will still be about 25%.


Cass Freight Index March 2022 Expenditures


Inferred Freight Rates

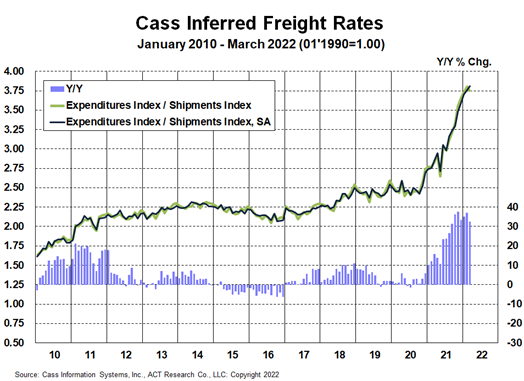
The freight rates embedded in the two components of the Cass Freight Index slowed to a 32% y/y increase in March from 37% in February.

  • Cass Inferred Freight Rates rose 1.1% m/m on a seasonally adjusted basis in March, setting another new record, but it was the slowest m/m increase in the past seven months.

The m/m increase is mainly as Omicron-related effects on capacity continue to push rates higher, which may continue to impact contract rates for a couple more months, even as downward pressure now emanating from the truckload spot market will have an increasing slowing effect over the course of the year.

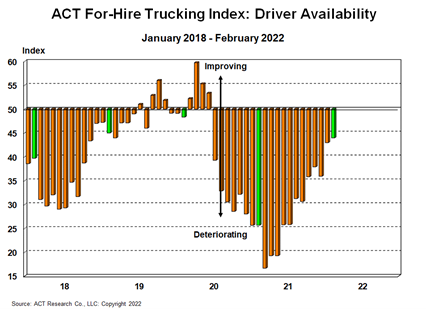
Though Class 8 tractor capacity remains limited and could tighten further if the Russia/Ukraine war worsens the chip shortage, we are seeing tangible signs of improvement in driver availability, which is disinflationary.

There have been tentative signs of recovering intermodal network fluidity, as chassis production continues to accelerate and workers return. But intermodal volumes continue to underperform the shipments component of the Cass Freight Index, so rail network congestion continues to add to Cass Inferred Freight Rates via excess miles in the freight network.

The true increase in freight costs is between the 14% y/y increase in the Cass Truckload Linehaul Index (below) and the 33% y/y increase in the inferred rate. The Truckload Linehaul Index does not include accessorial fees and rising fuel surcharges and does not consider excess miles. The inferred rate includes all costs across all modes.

After rising 23% in 2021, Cass Inferred Freight Rates are on a 23% trend again for 2022, though that seems unlikely to hold up.

Cass Inferred Freight Rates are a simple calculation of the Cass Freight Index data, expenditures divided by shipments, producing a data set that explains the overall movement in cost per shipment. The data set is diversified among all modes, with truckload representing more than half of the dollars, followed by LTL, rail, parcel, and so on.


Cass Freight Index March 2022 Inferred Rates


Download the data

Truckload Linehaul Index

The Cass Truckload Linehaul Index® rose 14.2% y/y in March to 163.4 after rising 12.7% y/y in February to 158.0.

  • We recently refined the data set to improve its reflection of the market, and the March increase is consistent with other contract rate sources.
  • Just as this index is catching up, the key leading indicators from the truckload spot market have fallen sharply over the past several weeks, which we expect will limit further upside in the Cass Truckload Linehaul Index. Normal contract timing would suggest there’s room for this index to continue to rise for a few more months after the peak in spot rates.


Cass Truckload Linehaul Index March 2022-1


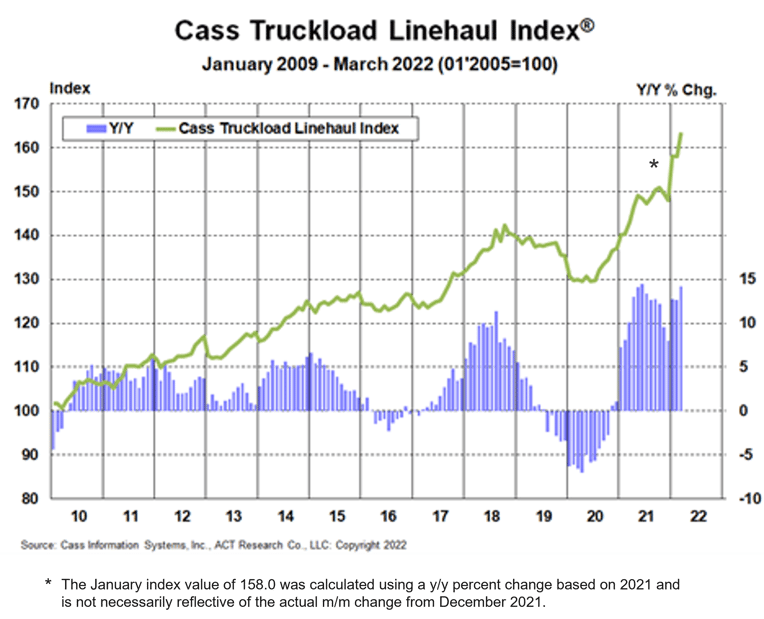
See the methodology for the Cass Truckload Linehaul Index.


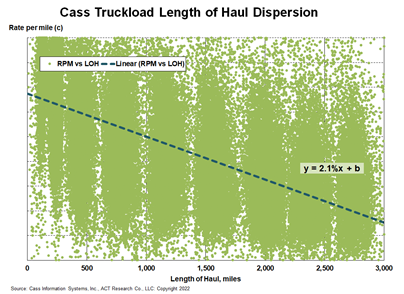
To demonstrate the effect of longer length of haul (LOH) on truckload rates, the scatter plot below analyzes a sample of 27 million truckload shipments in the Cass data set. This simple linear model that tells us that every 100-mile increase in LOH historically results in about a 2.1% lower rate per mile.

  • In March, the LOH in the Cass truckload data set was about 136 miles longer y/y, so LOH reduced the Cass Truckload Linehaul Index by about 2.9% and mileage-neutral truckload rates rose more like 17% y/y.


Truckload Length of Haul Dispersion ACT Research


Freight Expectations

Our outlook for the U.S. freight market, detailed in the ACT Freight Forecast report, seems to have swung from below consensus to above consensus in the past several weeks, as we think recession fears are overdone.

However, the pendulum has begun to swing. In early April, truckload spot rates inflected to y/y declines for the first time this cycle, but not the last. The ACT For-Hire Driver Availability Index has returned to levels where the rate turned down in late-2018 and 2019. Labor has recovered strongly from Omicron, which is deflationary for freight rates. Of course, spot rates are a leading indicator, so most of the effects of this change in the cycle will be felt further in the future.


ACT Research For-Hire Trucking Index Jan-Feb 2022


In our view, the combination of inflation, Fed monetary tightening, war in Europe, and substitution back to services from goods are shifting the freight cycle from the early stage to the late stage.

The recovery in labor capacity is again a key feature, though equipment production remains constrained and marginal capacity entering the market by paying nearly new truck prices for three-year-old used trucks will have a high cost base and difficulty competing at lower spot rates.

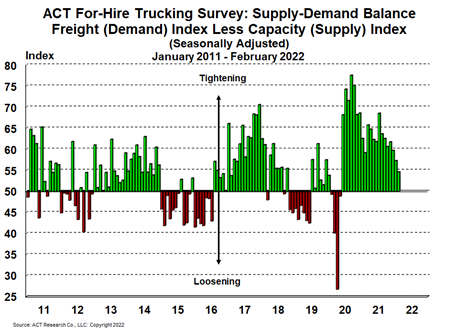
Supply shortages may still tighten the truckload sector, depending particularly on neon, and will continue to have a big impact on the direction of the U.S. freight cycle. For now, there is a clear rebalancing happening, which should put us in the peak of the rate cycle.


ACT Research For-Hire Trucking Survey Jan-Feb 2022


If you rely on freight data to run your business, you may want to take a look at the ACT Freight Forecast report, which provides monthly predictions for the TL, LTL and intermodal markets, including capacity, volumes and rates, and forecasts for the shipments component of the Cass Freight Index and the Cass Truckload Linehaul Index through 2023.


Release date: We strive to release our indexes on the 12th of each month. When this falls on a Friday or weekend, our goal is to publish on the next business day.

Tim Denoyer head

About the Author: Tim Denoyer, ACT Research

Tim Denoyer joined ACT Research in 2017, after spending fifteen years in equity research focused primarily on the transportation, machinery, and automotive industries. Tim is a senior analyst leading ACT’s team transportation research effort, and the primary author of the ACT Freight Forecast, U.S. Rate and Volume Outlook. Research associate Carter Vieth, who joined ACT in early 2020 after graduating from Indiana University, also contributes to the report. This report provides supply chain professionals with better visibility on the future of pricing and volume in trucking, the core of the $800 billion U.S. freight transportation industry, including truckload, less-than-truckload, and intermodal.

Tim also plays roles in ACT Research’s core Class 4-8 commercial vehicle data analysis and forecasting, in powertrain development, such as electrification analysis, and in used truck valuation and forecasting. Tim has supported or led numerous project-based market studies on behalf of clients in his four years with ACT Research on topics ranging from upcoming emissions and environmental regulations to alternative powertrain cost analyses to e-commerce and last-mile logistics to autonomous freight market sizing.

ACT’s freight research service leverages ACT’s expertise in the supply side economics of transportation and draws upon Tim’s background as an investment analyst, beginning at Prudential and Bear Stearns. Tim was a co-founder of Wolfe Research, one of the leading equity research firms in the investment industry. While with Wolfe, Tim was recognized in Institutional Investor’s survey of investors as a Rising Star analyst in both the machinery and auto sectors. His experience also includes responsibility for covering the industrial sector of the global equity markets, including with leading investment management company Balyasny Asset Management.

Disclaimer

The material contained herein is intended as general industry commentary. The Cass Freight Index, Cass Truckload Linehaul Index (“Indexes”), and other content are based upon information that we consider reliable, but Cass does not guarantee the accuracy, timeliness, reliability, continued availability or completeness of any information or underlying assumptions, and Cass shall have no liability for any errors, omissions or interruptions. Any data on past performance contained in the Indexes is no guarantee as to future performance. The Indexes and other content are not intended to predict actual results, and no assurances are given with respect thereto. Cass makes no warranty, express or implied. Opinions expressed herein as to the Indexes are those of Stifel and may differ from those of Cass Information Systems Inc. All opinions and estimates are given as of the date hereof and are subject to change.

Receive Index updates straight to your inbox