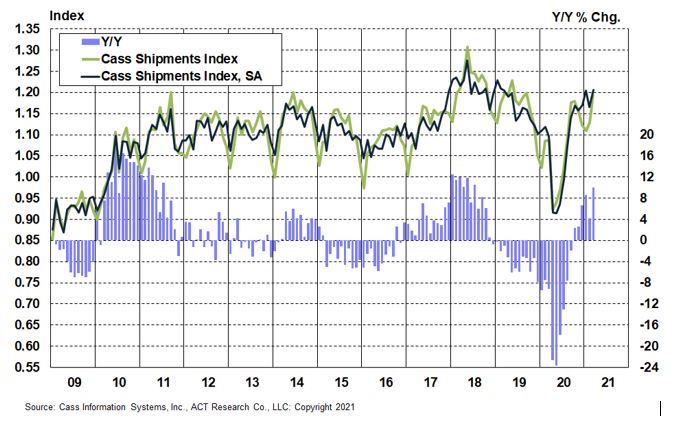
The shipments component of the Cass Freight Index® reaccelerated in March to a 10.0% y/y increase, recovering from the slowdown to 4.1% in February from the polar vortex and then some. The index increased 5.8% m/m from February, part of which is normal seasonality, but the increase was still up 3.4% m/m in March on a seasonally adjusted (SA) basis. This more than reversed the 3.2% m/m decline in February (SA) due to the weather event.
This freight volume improvement is consistent with our optimistic outlook, supported by inventory levels, consumer trends, and the backlog of freight anchored off U.S. ports. Near-term supply chain risks remain and, following the Suez Canal blockage, could briefly spread beyond the semiconductor shortages that will affect vehicle production at least through Q2 and perhaps considerably longer. However,
Chart: Cass Shipments Index, January 2009 – March 2021 (01’1990=1.00)
See the methodology for the Cass Freight Index.
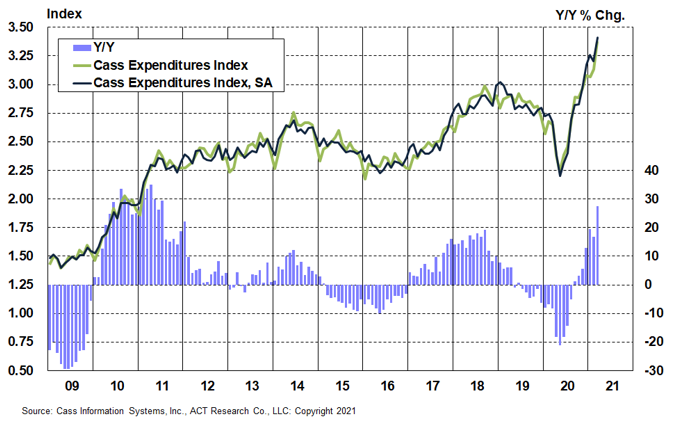
The expenditures component of the Cass Freight Index posted its third all-time record in the past four months in March, and was 27.5% above year-ago levels, surging from 16.9% y/y growth in February.
The acceleration came nearly evenly from both volumes and rates. On a seasonally adjusted basis, the 6.5% m/m jump in the Cass expenditures index came from a 3.4% m/m increase in the shipments, and a 3.5% m/m increase in the embedded rates.
Strong momentum continued in freight rate trends, with this month nearly off the chart, and we sense an axis adjustment on the way. This acceleration suggests Q2 y/y comparisons will be in the 40%-50% range, compared to the shutdown.
Chart: Cass Expenditures Index, January 2009 – March 2021 (01’1990=1.00)
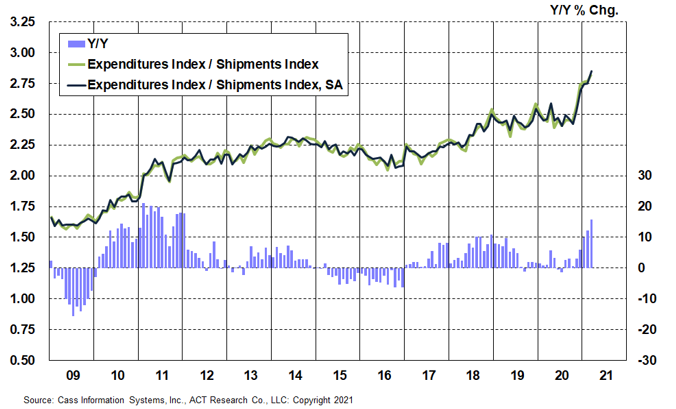
A simple calculation of the Cass Freight Index data (expenditures divided by shipments) produces a data set of “implied freight rates” that explains the overall movement in rates.
The freight rates embedded in the two components of the Cass Freight Index accelerated to a 15.8% y/y increase in March from a 12.3% y/y increase in February. The embedded rates rose 3.5% m/m on a seasonally adjusted basis, consistent with the rising trend of the past five months now. We still expect this trend to press higher near-term, as strong freight demand meets shortages of both drivers and trucks.
This data series is diversified among all modes, with truckload representing more than half of the dollars, followed by rail, LTL, parcel, and so on.
Chart: Cass Implied Freight Rates, January 2009 – March 2021 (01’1990=1.00)
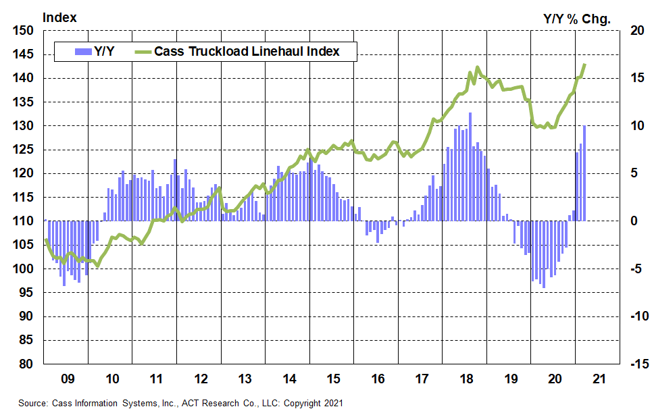
The Cass Truckload Linehaul Index® value of 143.1 in March exceeded the prior all-time record of 142.4 in October 2018, accelerating to an 10.1% y/y increase in March from an 8.1% y/y increase in February. On a m/m basis, the seasonally adjusted index was 2.0% higher than February, in the ninth straight increase.
As a reminder, the Cass Truckload Linehaul Index measures market fluctuations in per-mile truckload linehaul rates.
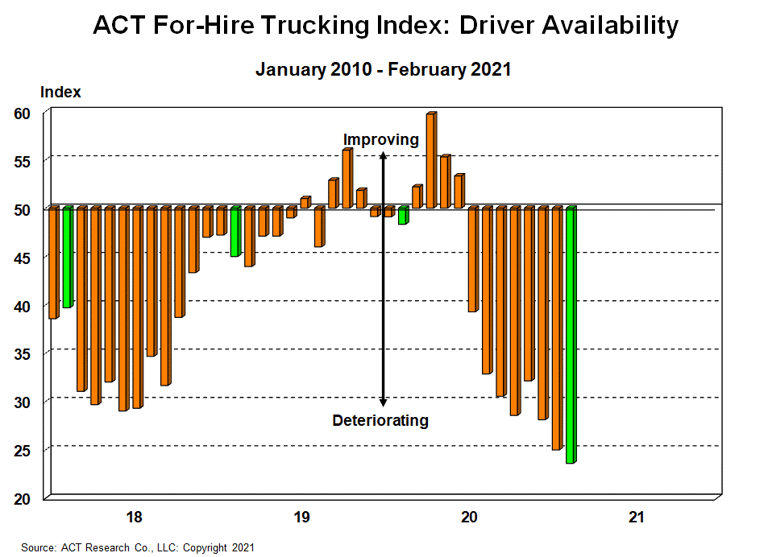
This trend is likely to persist with significant shortages of the two critical parts of transportation capacity: drivers and trucks. Driver availability is very low, as shown below, with demographics tightening and economic stimulus impacting driver school attendance. Meanwhile, parts shortages are likely to limit truck production at least through the first half of 2021 and likely beyond.
With a positive demand outlook and tight capacity, this setup suggests the Cass Truckload Linehaul Index will continue to rise in the near-term.
Chart: Cass Truckload Linehaul Index®, January 2009 – March 2021 (01’1990=1.00)
See the methodology for the Cass Truckload Linehaul Index.
The freight cycle is nearly in full swing as all of our index values, with the sole exception of the shipments data, posted new record highs this month.
The accelerating growth in our shipments index should continue consistent with the story on the railroads, and 2021 is setting up to be an extraordinarily strong year across the U.S. freight network. Since the strong rebound early in March from the polar vortex, rail trends have continued modestly above normal seasonal patterns, but the acceleration in the y/y data below in early-April is mainly due to easing prior year comparisons. Similar to the Cass Freight Index data, rail volumes will show extraordinary y/y growth in the coming months.
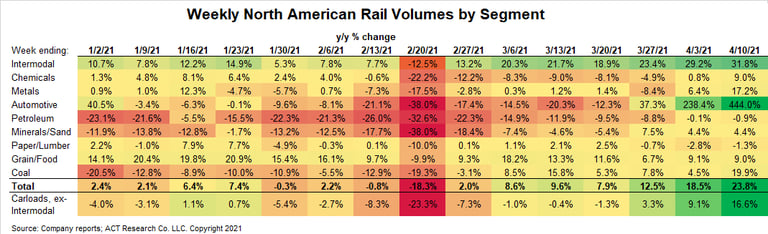
Trucking appears to be experiencing a similar pattern, and we should expect 30%-ish y/y increases in the next few months against the economic shutdown period in Q2 of last year. The focus should remain on sequential, seasonally adjusted trends in the coming months as the enormous y/y changes will be less informative.
While the strong freight market dynamics are primarily driven by the consumer sector, the industrial side of the U.S. economy continues to be challenged by supply chain shortages, mainly related to semiconductors. A frequent question we’re receiving is about how quickly these will be resolved. The readout from the White House meeting on 4/12 with industry leaders on this topic says short- and long-term solutions were discussed, including adding domestic capacity. Our understanding is the typical lead time on building new semiconductor capacity is about 18-24 months, so freight equipment capacity could be constrained longer than a few more months. While we believe the industry will find solutions sooner, this situation could add even more upward pressure on freight rates.
In addition to strong demand and tight equipment supply, the driver shortage is a major factor in the freight market equation. While it’s a complex issue (and discussed in depth in the ACT Freight Forecast Report), the record low driver availability here in early 2021 has perhaps played an even larger role in driving freight rates to record levels recently than the truck production challenges.
The ACT Freight Forecast provides data-driven predictions for supply, demand and rates in the truckload, LTL, and intermodal markets over a three-year planning horizon.

