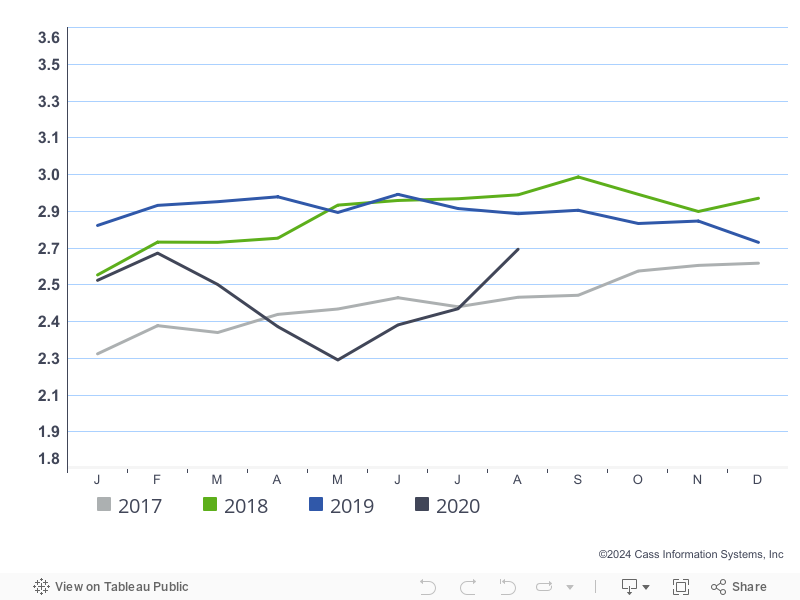
As a measure of economic activity, Cass Freight Index shipment volumes dropped 17.8% vs year-ago levels (Charts 1 & 2), better than last month’s -23.6% y/y change, but not good by any absolute measure. The index reading from May nudged up 3.5%, an acceleration from the 1.6% sequential improvement seen from April’s low to May. We believe the stock market run over the last few months has, therefore, largely been a function of very low interest rates (higher valuation multiples) and not a function of a better economy (higher earnings).
Chart 1 – June shipments show improvement, but not as sharp a snap-back as expected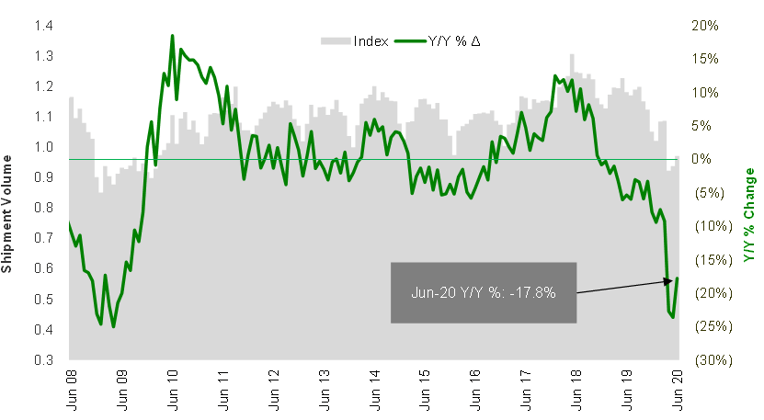
Source: Cass Information Systems, Inc and Stifel research
Chart 2 – Cass Freight Index - shipments are sharply below previous years
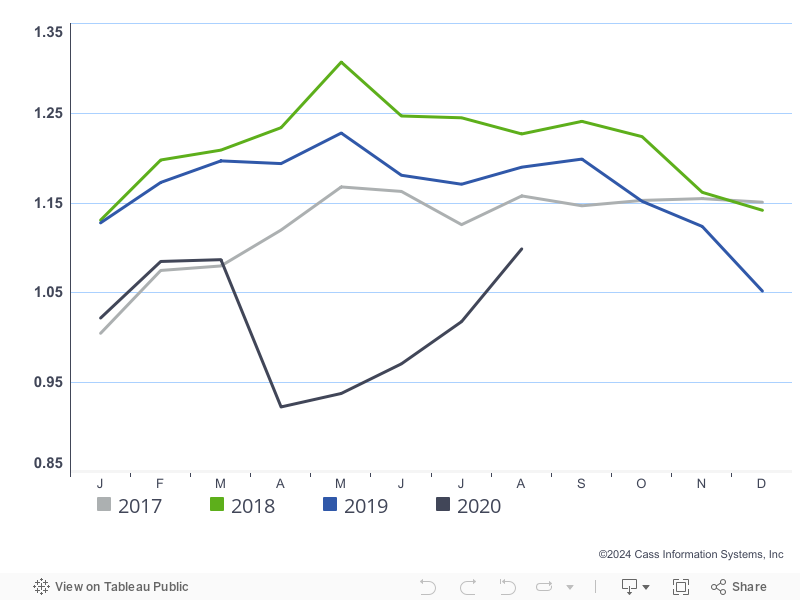
To activate the data download feature, double click within the chart area and then select the download icon.
Click here to receive a monthly alert when new reports are released.
Consumer confidence remained soft through June (Chart 3) and looks much more like the small Cass bounce in shipments than some of the other macro data bounces off the bottom. This recovery is still in the early stages, and certainly the timid consumer is unlikely to increase spending near-term (without further government “assistance”).
Chart 3 – June consumer confidence still below any reading of the past five years
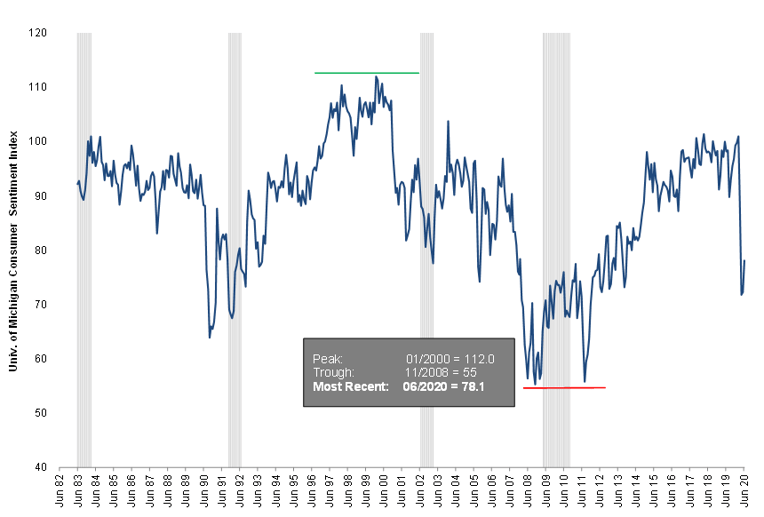
Source: University of Michigan
As for what’s coming into the U.S., June container volumes were down at the Ports of L.A. and Long Beach (Chart 4), but while ocean freight is not strong, yields continue to go higher due to steamship line capacity rationalization – something we’re not used to seeing from the ocean carriers. This is inflationary if the carriers remain disciplined for an extended period. Moving from the water to air, airfreight volumes have been strongest out of Asia (even as PPE demand has slowed and shifted more to ocean), but capacity in all lanes remains the major issue with most commercial belly capacity staying out of the market by some estimates until late 2021.
Chart 4 – Import/export activity on the West Coast better, but still below year-ago volumes
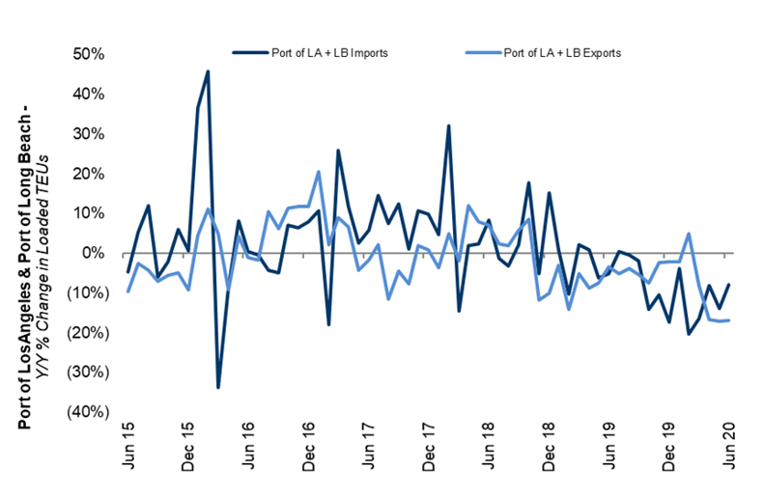
Source: Port of Los Angeles, Port of Long Beach
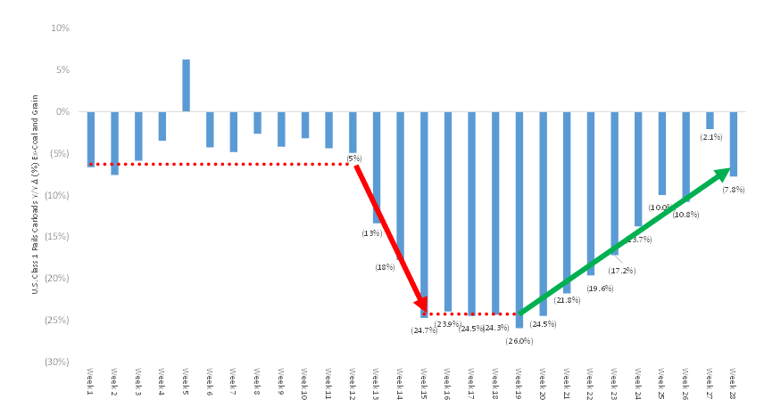
The weekly rail traffic data (Chart 5), excluding coal and grain shipments, showed steady improvements through the end of June and into July (the Week 27 comp was inflated due to an easy July 4th comp, as the holiday was observed on a Friday this year vs. a Thursday last year). This data set typically tracks similar to the Cass index (Chart 6), and while directionally still accurate, Cass has been lagging in the recovery. Halfway through July, the rail volume comps are getting better still, so we’d expect Cass to rise again next month.
Chart 5 – U.S. rail traffic shows steady week-to-week improvement into June
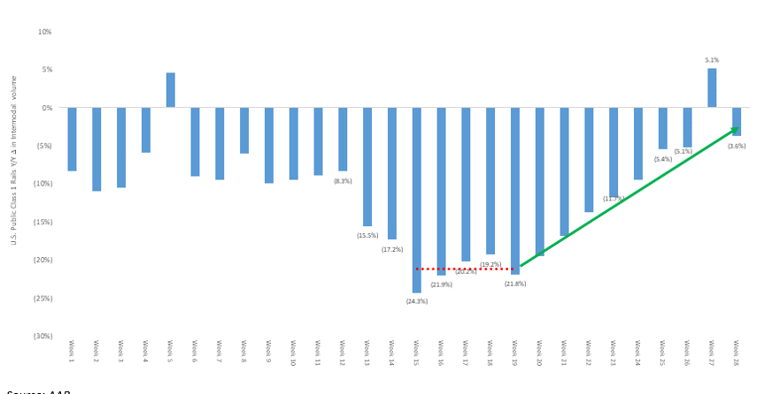
Note – Week 28 carloads are originations through the week of 7/11/2020
Source: Association of American Railroads and Stifel research
Chart 6 – We’ve seen a harder bounce reported from the rails, but Cass and rail volumes trending in same direction
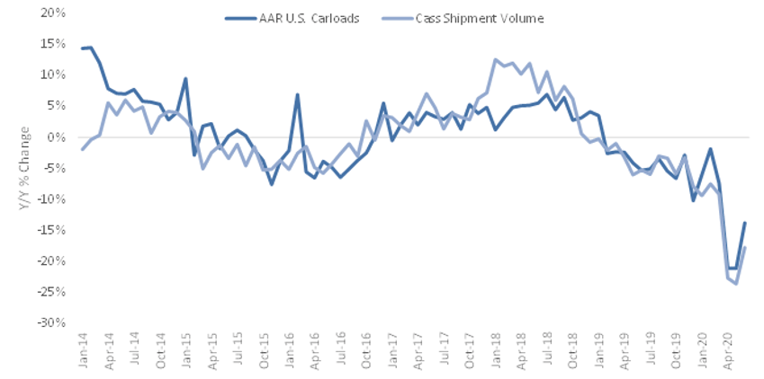
Source: Association of American Railroads, Cass Info Systems, and Stifel estimates
As for what shippers are paying, freight expenditures were down 18.3% y/y in June (Charts 7 & 8) – better than May’s low. Spending jumped 6.4% sequentially due to better volumes and higher pricing, but revenue per shipment was slightly down y/y, due mainly to lower fuel surcharges (Chart 9). There could also be some mix changes due to this odd period driving that number, as we’ve talked about in recent Cass reports. Shippers are still benefiting significantly from the lower fuel prices.
Chart 7 – Total freight expenditures back around 2016 levels
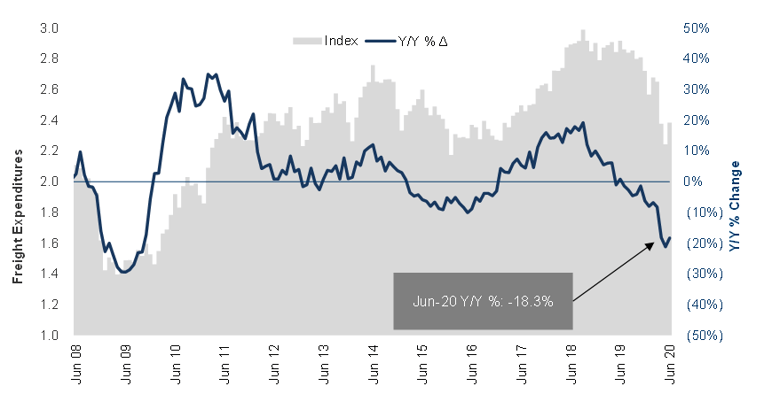
Source: Cass Information Systems, Inc. and Stifel research
Chart 8 – Total freight expenditures have taken a drastic hit
To activate the data download feature, double click within the chart area and then select the download icon.
Chart 9 – Diesel prices went nearly straight down from January-April but appear to have found a bottom – still ~20% below last year, weighing on reported yields
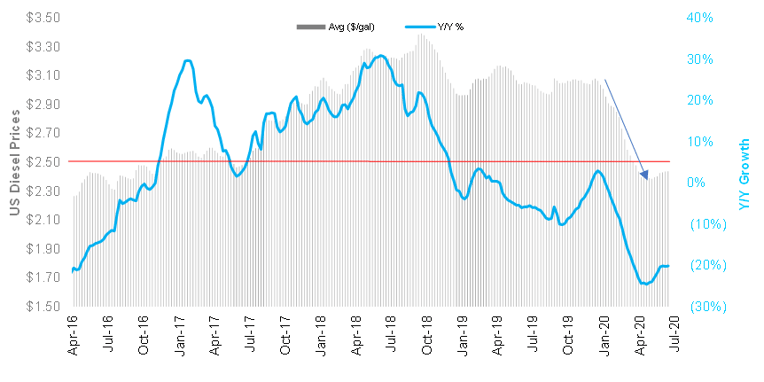
Source: Energy Information Administration
The Truckload Linehaul Index (Charts 10 & 11), measuring per-mile linehaul rates, takes a look at the largest (and most fragmented) market in the domestic transportation landscape, and it declined 5.9% y/y in June after a 5.0% y/y drop in May. The absolute index, which excludes fuel surcharges, also declined slightly sequentially from May to June and has been around the same absolute level (129-131) since January.
Supply is only coming out of industry, so why are rates not moving higher as demand recovers? We have heard that through the pandemic, shippers are continuing to be difficult in truckload contract rate negotiations. This may soon change, but we haven’t seen it yet.
Chart 10 – Truckload Linehaul Index bounces off bottom, but pricing remains soft
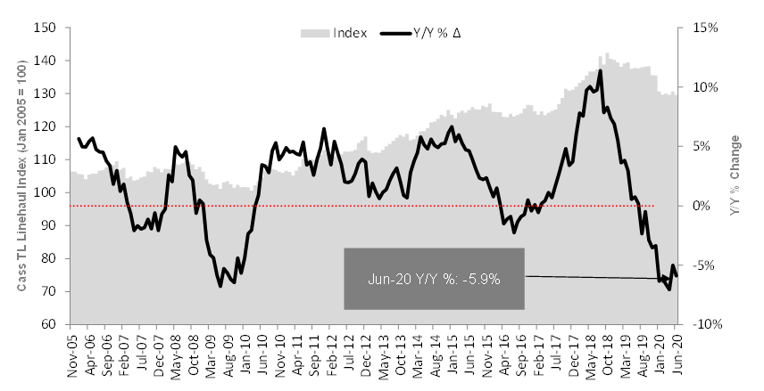
Source: Cass Information Systems, Inc. and Stifel research
Chart 11 – TL linehaul rates actually above 2017 levels

To activate the data download feature, double click within the chart area and then select the download icon.
When we look at spot rates (Chart 12) posted in June (and into this month), a much stronger pricing picture is painted than is reflected in the Cass Truckload Linehaul Index, which is comprised mostly of contract rates. Rates are currently tracking up 9.8% y/y (including fuel surcharges) in the dry van market. Reefer is up 4.6% y/y, while flatbed is now off just 4.4% vs a year ago. We believe the spot market (as well as the contract market) has bottomed and that the rebound in rates, as discussed above, will depend on the strength of the recovery coupled with the pinch of industry supply from factors besides just truck production – like rising insurance costs and limited driver supply.
Chart 12 – Spot rates for all truckload segments are back on the rise due to capacity constraints, and rates would be much higher were it not for fuel price declines
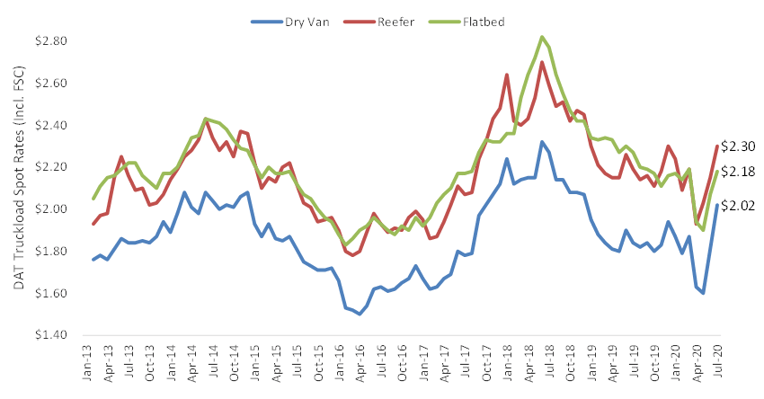
Source: DAT Solutions, through week ended 7/12/20
As we typically note, the Cass Truckload Linehaul Index (Chart 13) has a strong correlation to the quarterly yield metrics reported by the publicly traded TL carriers. And June’s data is showing that TL yields will probably average ~6% decline y/y in 2Q20.
Chart 13 – Cass Truckload Linehaul Index indicates public carrier yields soft throughout 2Q20
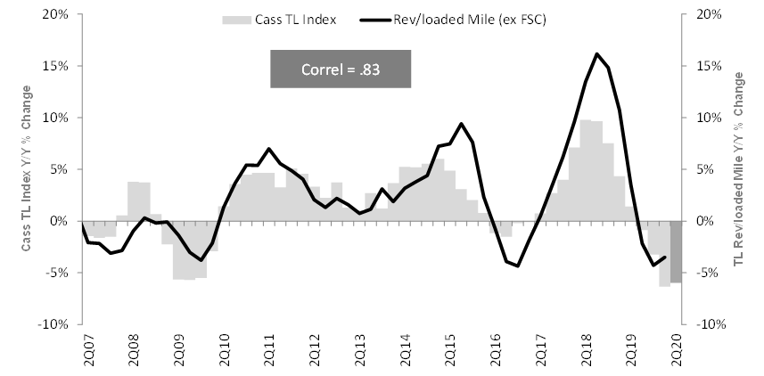
Source: Cass Information Systems, Inc., public carrier data and Stifel research
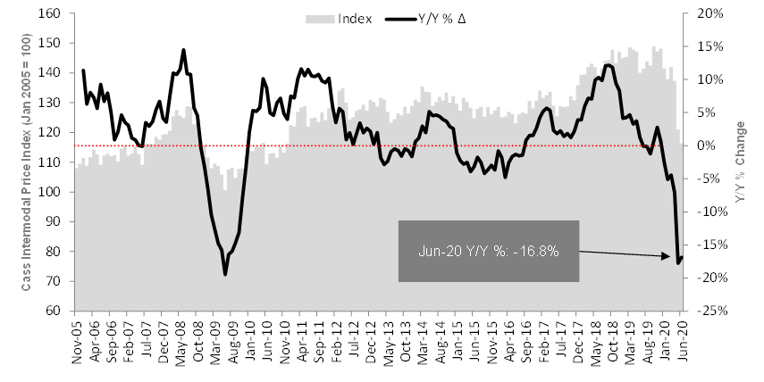
The Cass Intermodal Price Index (Charts 14 & 15), measuring total per-mile costs, looks at the smaller intermodal market and shows significantly worse trends than TL, falling 16.8% y/y in June. The big difference right now is in the fuel surcharge, as the Cass Truckload Linehaul Index excludes fuel surcharge, whereas the Intermodal index includes fuel surcharges. With diesel prices down ~20% y/y, we believe this accounts for roughly 5% of the difference. So, with intermodal volume comps improving through June (Chart 16), we are surprised rates are not stronger, unless the contract pricing is lagging truckload and still under pressure.
Chart 14 – Cass Intermodal Price Index shows big drop – largely driven by lower fuel
Source: Cass Information Systems, Inc., public carrier data and Stifel research
Chart 15 – Cass Intermodal Price Index - steeply below previous years

To activate the data download feature, double click within the chart area and then select the download icon.
Chart 16 –Comps for intermodal volumes showing nice bounce from the lows and are now better than pre-pandemic
Source: AAR
In summary, shipment volumes according to the Cass data showed improvement in June, as we make our way off the 2Q20 bottom. But, this does not paint a favorable picture of the overall U.S. economy, as there is still a long way to go before arriving back even at 2019 levels.