

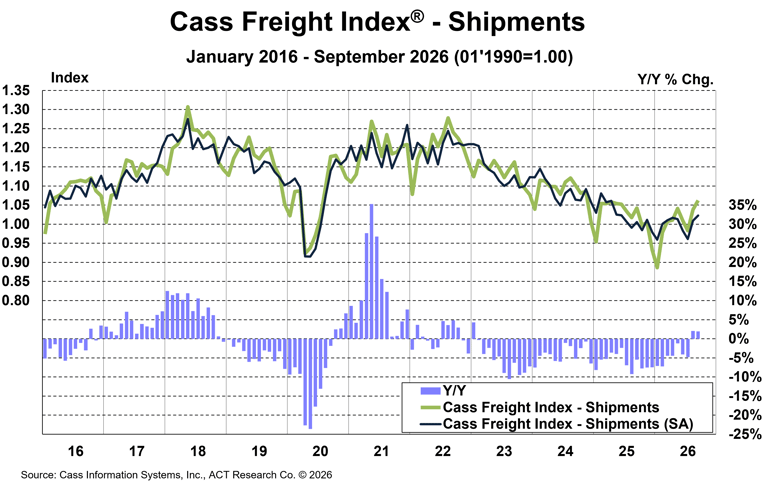
The shipments component of the Cass Freight Index rose 2.3% m/m and 1.9% y/y in September, the second straight y/y gain after a 3.5-year downturn by this measure, the longest on record.
In seasonally adjusted (SA) terms, shipments rose 1.4% m/m in September, building on the 5.0% sequential gain in August.
With modest retail and industrial growth, and some inventory restocking as container imports surge, freight demand is recovering. The combination of a smaller private fleet and rising new equipment sales also supports higher for-hire volumes.
While two months generally does not make a trend, and rising oil prices and interest rates are limiting factors, the cycle is on a positive track.
The normal seasonal pattern would put the shipments component of the Cass Freight Index up 4% y/y in October.
See the Methodology for the Cass Freight Index
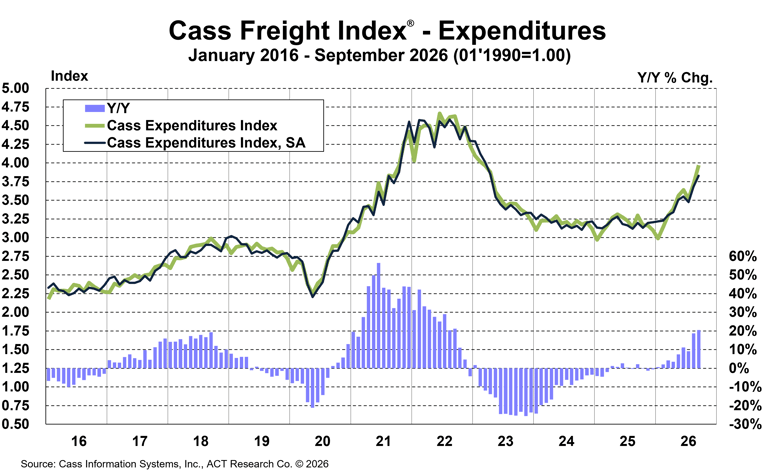
The expenditures component of the Cass Freight Index, which measures the total amount spent on freight, accelerated to 20% y/y growth in September to 3.970, up from a 19% gain in August.
The acceleration in the past two months, from a prior 5.5% YTD rate, was driven by higher shipments, rates, and fuel surcharges.
In SA terms, the index rose 4.0% m/m after a 6.0% gain in August.
After declines in 2023, 2024, and 2025, the expenditures component of the Cass Freight Index is on track for a 12% gain in 2026. With normal seasonality, the index would rise 23% y/y in October.
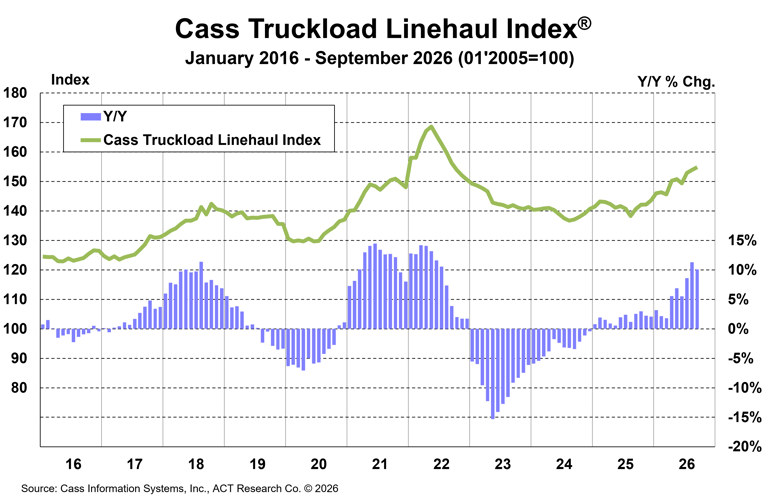
The Cass Truckload Linehaul Index rose to 154.8 in September, up 0.6% m/m and up 10.1% y/y.
The sequential increase is slower than the 0.9% YTD average, likely because spot rates retrenched somewhat and contract rates slowed with few bids this time of year.
Even as spot rates slow with modest sequential declines, the much larger contract market is still adjusting higher.
This index reflects the whole for-hire truckload market, both spot and contract rates.
The Cass Truckload Linehaul Index fell 10% in 2023, another 3.4% in 2024, and turned up to a 1.8% increase in 2025. In 2026, the index is on pace for a 7% increase.
See the Methodology for the Cass Truckload Linehaul Index

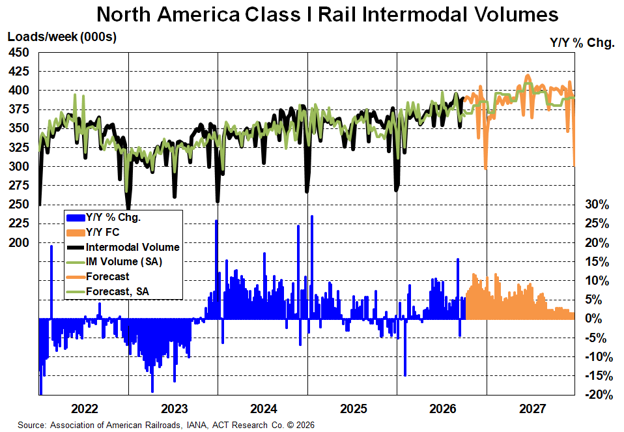
As evidence that the freight demand cycle is improving and this could be the start of a trend, we present recent trends and our forecasts for intermodal loads on the North American Class I railroads for the rest of this year and 2027.
In 2026, NA intermodal volumes are on track to break the 2018 record. We estimate 19.3 million intermodal loads in 2026, breaking the previous record of 18.9 million in 2018. And we expect 2027 to be another record year, with the intermodal cost advantage above average.
The biggest question to us is how the railroads will execute on the higher demand level. At industry conferences this month, executives assured us there’s a cushion of capacity and they’re stacking chassis to be ready to serve record volumes in the coming months.
Need more freight market intelligence? The ACT Research Freight Forecast comprehensively covers TL, LTL, and intermodal volumes and rates, with the best quality data sets in the industry. ACT Research forecasts through 2028 are detailed in the Freight Forecast report.
This service provides in-depth analysis and forecasts for a broad range of U.S. freight measures, including the Cass Freight Index, Cass Truckload Linehaul Index, and DAT spot and contract rates by trailer type, with and without fuel. We provide monthly, quarterly, and annual predictions over a two- to three-year time horizon, including capacity, volumes, and rates. The ACT Research Freight Forecast is released monthly in conjunction with the Cass Transportation Index report.
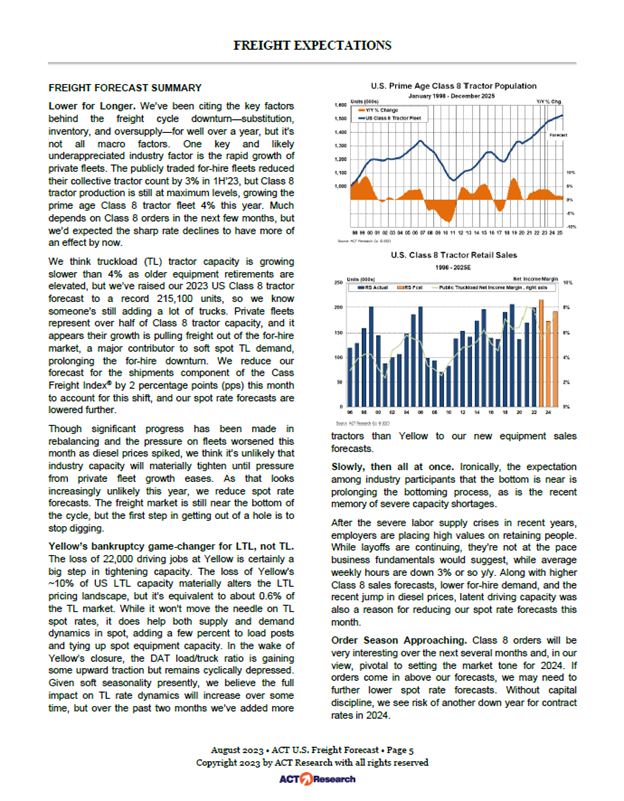
For a sense of forecast accuracy, please see this one-page monthly summary, from mid-2023. While these dynamics have reversed, we think it will help you understand why our supply-side perspective is helpful for planning, strategy, and forecasting.
(As a reminder, ACT Research’s Tim Denoyer writes this report.)
Release date: We strive to release our indexes on the 13th of each month. When this falls on a Friday or weekend, our goal is to publish on the next business day.