Cass Transportation Index Report February 2022

Get the most up-to-date data and insights into shipping volumes and the cost of freight. See how they change each month and understand the market forces behind them.

SubscribeDownload Historical Data Points (xls)

Regaining Ground

  February 2022 Year-over-year change 2-year stacked change Month-to-month change Month-to-month change (SA)
Cass Freight Index - Shipments 1.171 3.6% 7.9% 8.6% 3.6%
Cass Freight Index - Expenditures 4.453 42.2% 66.2% 10.6% 7.0%
Truckload Linehaul Index* 158.0 12.6% 21.8% 0.0%* 0.0%*


* If you follow our truckload linehaul index closely, please take note. As we do occasionally, we have fine-tuned our index methodology. Due to this, we have revised our January 2022 index value from 150.2 to 158.0 (the same value as February).

Cass Freight Index - Shipments

U.S. freight volumes regained ground in February after a significant January Omicron impact, with the shipments component of the Cass Freight Index up 8.6% from January, and up 3.6% y/y.

  • The 3.6% m/m (SA) increase in the shipments component of the Cass Freight Index reversed almost half of the 7.4% Omicron-related decline in January.
  • Omicron effects lingered into February, so we would expect further sequential improvement in March. War-related effects on freight volume are likely to be small in the near-term, but higher energy prices will have an increasingly negative effect over time.


Cass Freight Index Shipments Feb2022


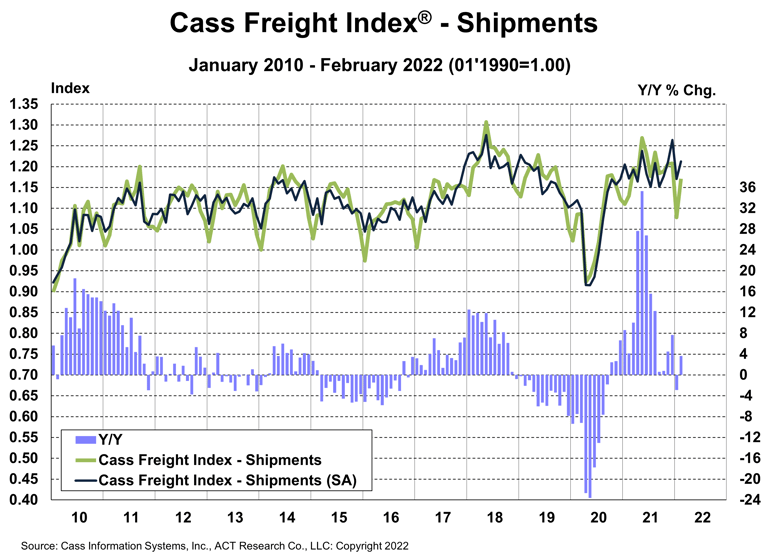
See the methodology for the Cass Freight Index.


Cass Freight Index - Expenditures

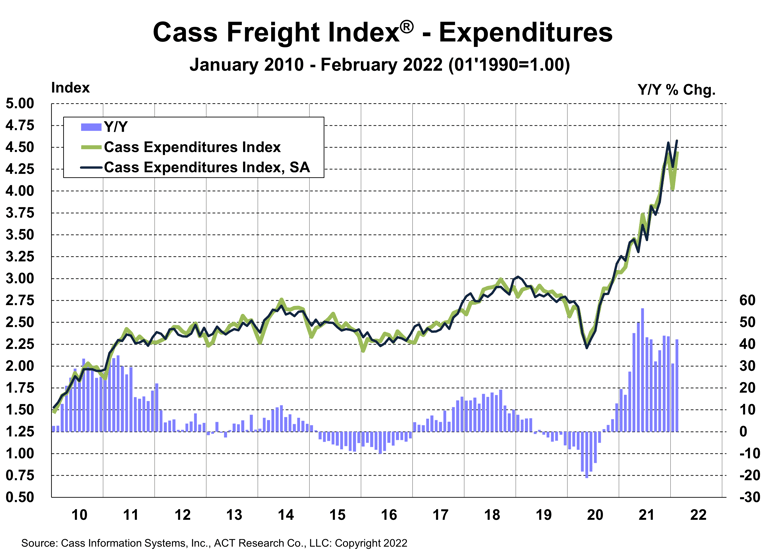
The expenditures component of the Cass Freight Index, which measures the total amount spent on freight, rose 10.6% m/m in February to 4.453 after an 8.9% Omicron impact in January, and was up 42% y/y.

  • On an SA basis, expenditures rose 7.0% m/m, mostly on the rebound in shipment volumes, but higher rates also played a role.
  • On a two-year stacked basis, the Expenditures component of the Cass Freight Index was up 66% in February, with shipments up 8% and rates up 54%.

This index rose 38% in 2021, after a 7% decline in 2020 and no change in 2019. Tougher comparisons in the coming months will naturally slow these y/y increases, but just using normal seasonality from here, the increase in 2022 will still be about 25%.


Cass Freight Index Expenditures-Feb2022


Inferred Freight Rates

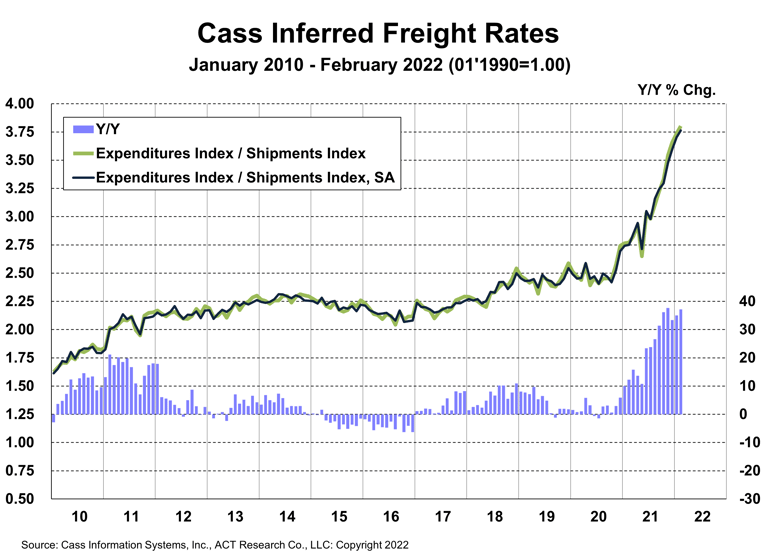
A simple calculation of the Cass Freight Index data (expenditures divided by shipments) produces a data set of inferred freight rates that explains the overall movement in cost per shipment.

  • The freight rates embedded in the two components of the Cass Freight Index accelerated to a 37% y/y increase in February from 35% in January.
  • Cass Inferred Rates rose 1.6% m/m on a seasonally adjusted basis in February, setting another new record.

The m/m increase is mainly as Omicron-related effects on capacity continue to push rates higher, which will continue to impact new contract rates for a few more months. However, in early March there are signs of lower spot rates despite the large increase in fuel prices.

Though Class 8 tractor capacity remains tight and is at increased risk if the Russia/Ukraine war worsens the chip shortage, we are seeing tangible signs of improvement in driver availability, which could begin to slow the trend in freight rates.

As the railroads continue to struggle, excess miles in the freight network are persisting, which also adds to these costs. Chassis production has only improved enough to turn the direction of the chassis fleet from contraction to slight growth, and the chassis fleet remains far from what is needed to address rail network congestion.


Rail volumes by Segment Feb2022


After rising 23% in 2021, Cass Inferred Freight Rates are on a 23% trend again for 2022. The data set is diversified among all  domestic modes, with truckload representing more than half of the dollars, followed by LTL, rail, parcel, and so on.


Cass Freight Index Inferred Rates Feb2022


Download the data

Truckload Linehaul Index

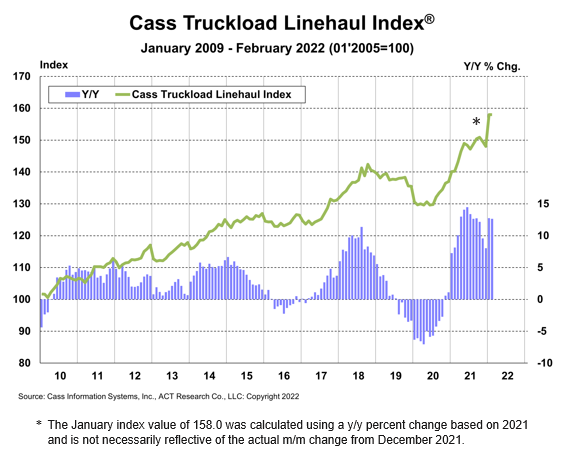
The Cass Truckload Linehaul Index® rose 12.6% y/y in February after an upwardly revised 12.8% y/y increase in January to 158.0.

  • Recognizing this data series trends below the ~20% increases in public TL fleet per-mile rates, we have fine-tuned the process with a broader information set to improve its reflection of the market.
  • We estimate a 3% downward impact from longer length of haul (due to mode shift from rail to truck) on the Cass Truckload Linehaul Index. Adjusting for this, both sets of rates (Cass and public truckload carriers) are rising in the mid- to high-teens percentages here in early 2022. In other words, if length of haul was not increasing we would likely be reporting a ~16% increase in this index. (Though we don’t have much Q1 data from public fleets, ACT Research has a strong track record of forecasting these rates.)

Excess miles, rising fuel surcharges, and accessorial fees are all factors which are not reflected in the Cass Truckload Linehaul Index, so the increase in total truckload cost, depending on how these factors shake out, is between the 13% y/y increase in the Cass Truckload Linehaul Index and the 37% y/y increase in the inferred rate (which, as a reminder, is a mix of all domestic modes).

Strong freight demand and significant capacity limitations are continuing to press truckload rates higher. As intermodal network congestion gradually eases over the course of 2022, a reversal to shorter length of haul will likely add upward pressure to this index above and beyond market rate increases.


Cass Truckload LH Index-Feb2022


See the methodology for the Cass Truckload Linehaul Index.


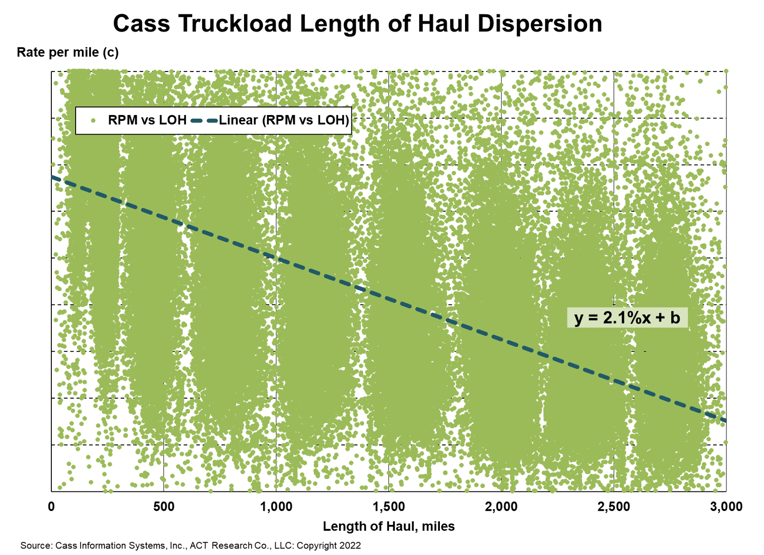
To demonstrate the effect of longer length of haul (LOH) on truckload rates, the scatter plot below analyzes a sample of 27 million truckload shipments in the Cass data set. Though the data set is so deep it arguably needs at least another dimension, we can say from this simple linear model that every 100-mile increase in LOH historically results in about a 2.1% lower rate per mile.

In February, the LOH in the Cass truckload data set was about 141 miles longer y/y, so LOH reduced the Cass Truckload Linehaul Index by about 3.0% and mileage-neutral truckload rates rose more like 16% y/y.


Cass Truckload Length of Haul v Rates


Freight Expectations

Energy markets aside for the moment, global supply of neon gas, critical for laser lithography in semiconductor manufacturing, just so happens to be concentrated in Odessa, Ukraine, an export hub on the Black Sea. These gases, purified in Ukraine but generated in Russian steelmaking, supply roughly half of the world’s neon, according to various estimates, and ~90% of U.S. chip-making neon supply, according to Techcet, specialty chemical consultants. Supplies of nickel, palladium, and other commodities are also at risk.

Just as chip supply was starting to improve, the risk to auto and truck manufacturing supply chains has risen again. A worsening chip shortage could hit vehicle production and tighten trucking markets further, and the energy shock brings a whole different set of repercussions for the economy at large.

The spike in crude oil prices to $120+ per barrel as the U.S. moved to cut off Russian oil imports will cost U.S. consumers and slow freight demand. Truckload fleets pass through most of their fuel costs, but generally do not have surcharges on empty miles, so there is a modest financial hit to carriers. Shippers face a roughly 5% increase in U.S. truckload freight costs this year just from adjusting fuel surcharges to higher prices, assuming things settle down a bit from here.

In the week after the war started, U.S. retail gasoline prices jumped 50c per gallon and diesel surged 75c to a record $4.85 from $4.10 per gallon. In a week, this added about 4% to the cost of truckload freight, about 12c/mile in fuel surcharge. But spot rates have not risen to account for the higher fuel price, implying deflation net of fuel. Supply side progress continues, and we’ve lowered our GDP forecasts to account for significantly higher fuel costs.


If you rely on freight data to run your business, you may want to take a look at the ACT Freight Forecast report, which provides monthly predictions for the TL, LTL and intermodal markets, including capacity, volumes and rates, and forecasts for the shipments component of the Cass Freight Index and the Cass Truckload Linehaul Index through 2023.


Release date: We strive to release our indexes on the 12th of each month. When this falls on a Friday or weekend, our goal is to publish on the next business day.

Tim Denoyer head

About the Author: Tim Denoyer, ACT Research

Tim Denoyer joined ACT Research in 2017, after spending fifteen years in equity research focused primarily on the transportation, machinery, and automotive industries. Tim is a senior analyst leading ACT’s team transportation research effort, and the primary author of the ACT Freight Forecast, U.S. Rate and Volume Outlook. Research associate Carter Vieth, who joined ACT in early 2020 after graduating from Indiana University, also contributes to the report. This report provides supply chain professionals with better visibility on the future of pricing and volume in trucking, the core of the $800 billion U.S. freight transportation industry, including truckload, less-than-truckload, and intermodal.

Tim also plays roles in ACT Research’s core Class 4-8 commercial vehicle data analysis and forecasting, in powertrain development, such as electrification analysis, and in used truck valuation and forecasting. Tim has supported or led numerous project-based market studies on behalf of clients in his four years with ACT Research on topics ranging from upcoming emissions and environmental regulations to alternative powertrain cost analyses to e-commerce and last-mile logistics to autonomous freight market sizing.

ACT’s freight research service leverages ACT’s expertise in the supply side economics of transportation and draws upon Tim’s background as an investment analyst, beginning at Prudential and Bear Stearns. Tim was a co-founder of Wolfe Research, one of the leading equity research firms in the investment industry. While with Wolfe, Tim was recognized in Institutional Investor’s survey of investors as a Rising Star analyst in both the machinery and auto sectors. His experience also includes responsibility for covering the industrial sector of the global equity markets, including with leading investment management company Balyasny Asset Management.

Disclaimer

The material contained herein is intended as general industry commentary. The Cass Freight Index, Cass Truckload Linehaul Index (“Indexes”), and other content are based upon information that we consider reliable, but Cass does not guarantee the accuracy, timeliness, reliability, continued availability or completeness of any information or underlying assumptions, and Cass shall have no liability for any errors, omissions or interruptions. Any data on past performance contained in the Indexes is no guarantee as to future performance. The Indexes and other content are not intended to predict actual results, and no assurances are given with respect thereto. Cass makes no warranty, express or implied. Opinions expressed herein as to the Indexes are those of Stifel and may differ from those of Cass Information Systems Inc. All opinions and estimates are given as of the date hereof and are subject to change.

Receive Index updates straight to your inbox