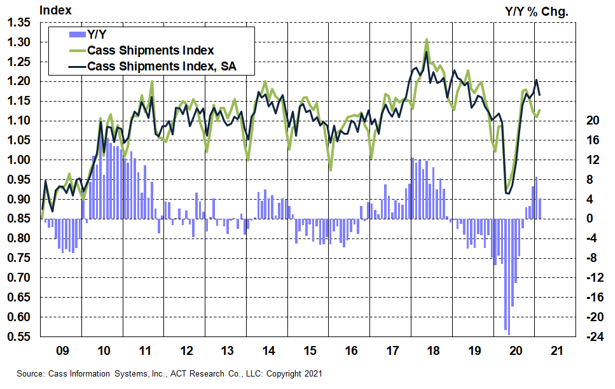
The shipments component of the Cass Freight Index® was impacted by the polar vortex event in mid-February, slowing the y/y growth rate to 4.1% in February from 8.6% in January, as anticipated in the latest ACT Freight Forecast report released earlier this month.
The shipments index increased 1.8% m/m from January, which was well below the usual seasonal increase. When we seasonally adjust the index, February shipments were down 3.2% m/m. Reversing a SA 3.0% m/m increase from December to January, this slowdown reflects both the short-term weather effects and likely longer-lasting supply chain pain points, which are anticipated to slow the industrial recovery for a few months.
The significant supply side issues will only temporarily belie the strong demand environment, and considerable acceleration in freight demand is still most likely. With much easier prior-year comparisons ahead, if the Cass shipments index just takes a normal seasonal pattern from here, it will be up over 25% y/y in Q2. On a two-year stacked basis, the Cass Shipments Index was still 5.6% below February 2019.
Chart: Cass Shipments Index, January 2009 – February 2021 (01’1990=1.00)
See the methodology for the Cass Freight Index.
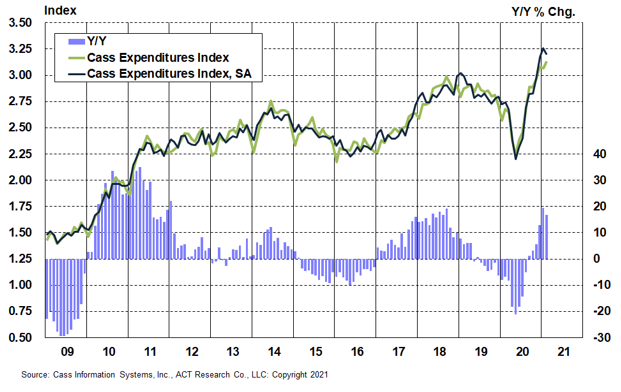
The Cass expenditures index is a measure of the total dollars spent on freight (which is a function of both shipment volumes and rates). This index posted its second all-time record in three months in February, and was 16.9% above year-ago levels, decelerating from 19.5% y/y growth in January.
The deceleration was driven primarily by volumes, with the Cass shipments index down 3.2% m/m (SA), as strong momentum continued in freight rate trends. On a seasonally adjusted basis, the Cass expenditures index fell 1.7% m/m, less than the shipments index because of higher rates (see our Implied Freight Rates below).
Significant further acceleration remains a high probability in the coming months for the Cass expenditures index as well.
Chart: Cass Expenditures Index, January 2009 – February 2021 (01’1990=1.00)
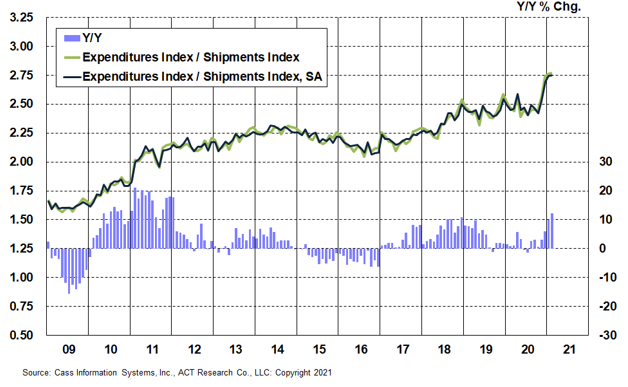
A simple calculation of the Cass Freight Index data (expenditures divided by shipments) produces a data set of “implied freight rates” that explains the overall movement in rates.
The freight rates embedded in the two components of the Cass Freight Index accelerated to a 12.3% y/y increase in February from a 10.1% y/y increase in January. The quicker rate performance was largely due to an easier comparison as rates were still sliding this time last year. However, the implied rates were still up 0.3% m/m on a seasonally adjusted basis, even after three straight months of large increases.
This data series is diversified among all modes, with truckload representing more than half of the dollars, followed by rail, LTL, parcel, and so on.
Chart: Cass Implied Freight Rates, January 2009 – February 2021 (01’1990=1.00)
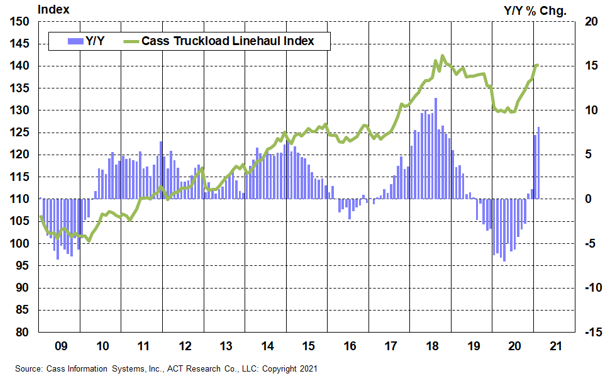
The Cass Truckload Linehaul Index® accelerated to an 8.1% y/y increase in February from a 7.3% y/y increase in January. On a m/m basis, the seasonally adjusted index was 0.1% higher than January, in a consolidation after seven significant sequential increases since June 2020.
The freight markets remain very tight, with significant restraints on two key parts of transportation capacity: drivers and trucks. Driver demographics are tightening, and the economic stimulus will add more competition for drivers as parts shortages limit truck production in early 2021.
With a positive demand outlook and a tight supply side, this setup suggests the Cass Truckload Linehaul Index® will continue to rise in the near term.
Chart: Cass Truckload Linehaul Index®, January 2009 – February 2021 (01’1990=1.00)
See the methodology for the Cass Truckload Linehaul Index.
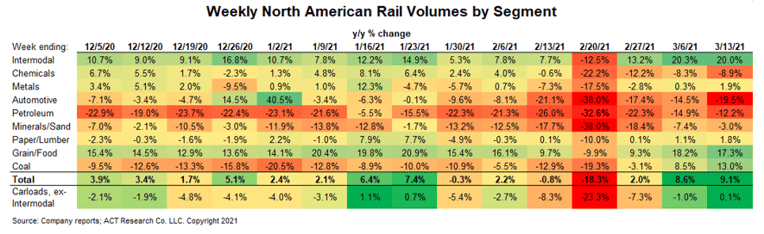
The slower growth in the Cass shipments index is consistent with the railroads’ February experience, when volumes saw a sharp but brief one-week decline. This coiled the spring, if you will, for an even stronger rebound in activity during the first two weeks of March.
Trucking appears to be experiencing a similar pattern, and while March will compare against the pantry-stocking freight surge at the start of the pandemic last year, the real easing of the comp is from April into June. We’ll focus more on sequential, seasonally adjusted trends in the coming months as the enormous y/y changes will be less informative.
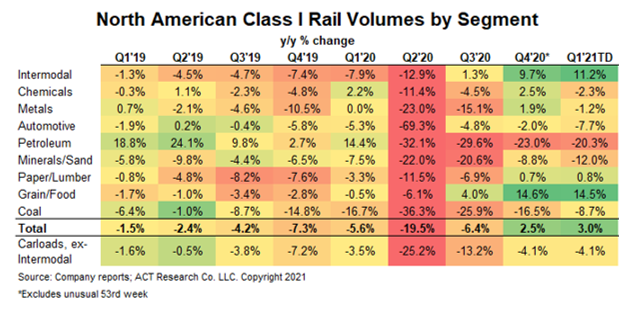
The rail volume recovery was slowing in the weeks before the polar vortex, likely a result of port bottlenecks and a variety of parts shortages restraining the supply side. But freight demand is clearly still very strong, and we still expect a strong U.S. industrial recovery this year, eventually.
Our economic growth and freight forecasts are higher still this month as we more fulsomely factor in the $1.9 trillion stimulus package that is just starting to distribute cash. Even with the temporary hit in mid-February, the rail volume recovery continues on a quarterly basis, accelerating out of a two-year downturn toward much faster growth rates.
The parts shortages that are slowing auto and truck production are at once impacting freight volumes and limiting the manufacturers’ ability to respond with more shiny new equipment, which itself is an effective recruiting tool, so this tightness will not revert overnight. Still, this is a temporary issue with the wrinkles likely ironed out by around mid-year. It could drag on further, though; and regardless, it will keep capacity tighter for longer than if manufacturers were able produce at their own pace.
For more information on why we expect 2021 to resemble 2018 more than 2019 for freight rates, and on when shippers should expect significant rate relief, please take a look at the ACT Freight Forecast report, which is now forecasting TL, LTL, and intermodal rates through 2023.

