Cass Transportation Index Report December 2022

Get the most up-to-date data and insights into shipping volumes and the cost of freight. See how they change each month and understand the market forces behind them.

SubscribeDownload Historical Data Points (xls)

Freight Cost Savings Materializing

But there's a silver lining for fleets at the end 

  December  2022 Year-over-year change 2-year stacked change Month-to-month change Month-to-month change (SA*)
Cass Freight Index - Shipments 1.161 -3.9% 3.5% -3.3% 1.2%
Cass Freight Index - Expenditures 4.231 -4.3% 37.5% -5.5% -4.2%
Cass Inferred Freight Rates 3.644 -0.4% NA -2.2% -5.3%
Truckload Linehaul Index 150.54 1.7% 9.9% -1.0% --


* SA = seasonally adjusted

Cass Freight Index - Shipments

The shipments component of the Cass Freight Index® fell 3.9% y/y in December. On a m/m basis, the index fell 3.3%, but seasonality boosts December’s m/m performance to a 1.2% gain on an SA basis.

  • The larger y/y decline, mainly on a tough comparison, was not a surprise to our readers, but we’d characterize the sequential, seasonally adjusted increase as further evidence of resilient, but still soft freight demand.
  • With retail sales broadly growing in line with inflation rates, it’s clear that peak holiday shipping volumes were flattish in real terms versus a year ago.

Normal seasonality from here would have shipments back in positive territory y/y in 1H’23, but sharpening declines in imports, into the West Coast in particular, suggest near-term trends may soften further.

Cass Freight Index Shipments December 2022


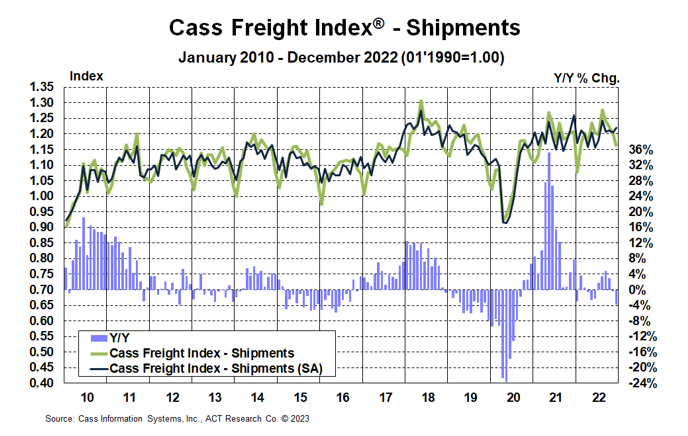
See the methodology for the Cass Freight Index.


Cass Freight Index - Expenditures

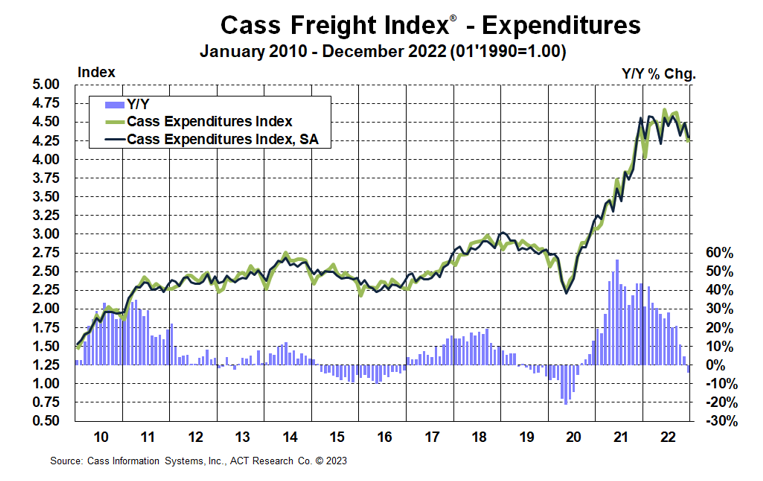
The expenditures component of the Cass Freight Index, which measures the total amount spent on freight, fell 4.3% y/y in December, inflecting from a 4.7% increase in November.

Expenditures fell 5.5% m/m after a 1.8% increase in November. Against a shipment decline of 3.3% m/m in December, we infer rates were down 2.2% (see our inferred rates data series below). The decrease in rates m/m seems mainly due to lower truckload contract rates.

  • On an SA basis, expenditures fell 4.2% m/m in December, with shipments up 1.2% m/m and rates down 5.3%.  

This index includes changes in fuel, modal mix, intramodal mix, and accessorial charges, so is a bit more volatile than the cleaner Cass Truckload Linehaul Index®.

The expenditures component of the Cass Freight Index rose 23% in 2022 after a record 38% increase in 2021 but is set to retrench in 2023.


Cass Freight Index Expenditures December 2022


Inferred Freight Rates

The rates embedded in the two components of the Cass Freight Index turned to a 0.4% y/y decline in December, after 5.1% y/y growth in November.

  • Cass Inferred Freight Rates fell 2.2% m/m (down 5.3% SA) in November. Aside from some noise in this series as a result of fuel prices and modal mix, the trend has clearly turned lower over the course of 2022 and is poised to continue in this direction in the near term.

Freight rates are on track to fall 5% in 2023 just based on the normal seasonal pattern of this index. With loose market conditions and some welcome relief in diesel prices, the actual decline is likely to be a good bit larger.  

Along with sharp declines in ocean rates and many commodity prices, lower freight costs aid the outlook for significant disinflation needed to improve economic conditions.


Cass Inferred Freight Rates December 2022


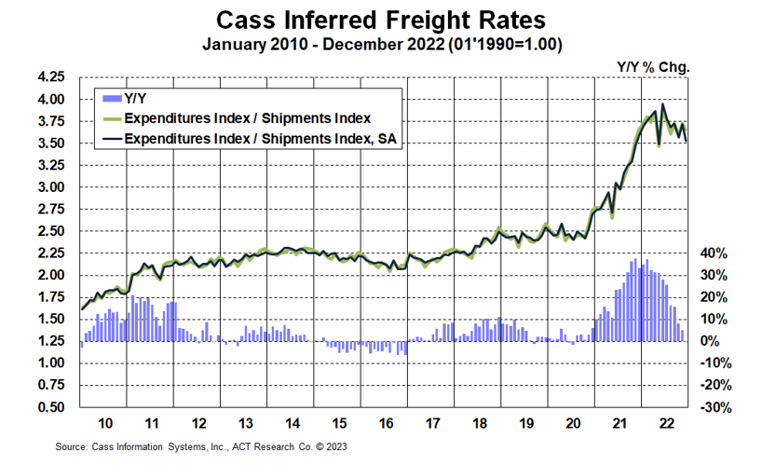
Cass Inferred Freight Rates are a simple calculation of the Cass Freight Index data—expenditures divided by shipments—producing a data set that explains the overall movement in cost per shipment. The data set is diversified among all modes, with truckload (TL) representing more than half of the dollars, followed by less-than-truckload (LTL), rail, parcel, and so on.


Download the data

Truckload Linehaul Index

The Cass Truckload Linehaul Index fell 1.0% m/m in December to 150.5, after a 1.2% m/m decline in November.

  • On a y/y basis, the Cass Truckload Linehaul Index was up 1.7% after a similar increase in November.
  • With a tougher comparison in January, this index is likely to turn down on a y/y basis. New truckload contracts are generally being renewed with considerable rate reductions, but this pressure will be partly offset by strong trends since Thanksgiving in spot rates, which have held most of their gains even as drivers have by and large come back from holiday break.
  • As a broad truckload market indicator, this index includes both spot and contract freight, and with spot rates already down significantly, the larger contract market is likely to continue adjusting down more gradually but in the same direction. 


Cass Truckload Linehaul Index December 2022-1


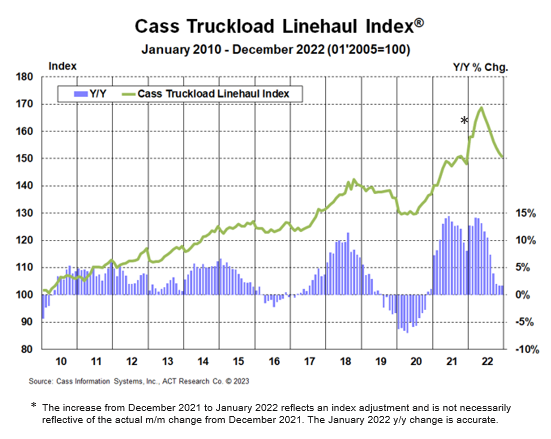
See the methodology for the Cass Truckload Linehaul Index.


Freight Expectations

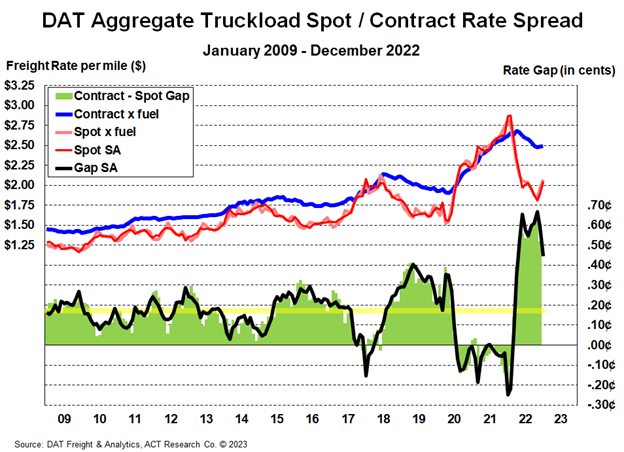
As we enter 2023, we see the truckload market transitioning from the late-cycle stage to the bottoming stage. Some of the recent rise in spot rates, ex-fuel, is due to seasonality, as rates surged toward the end of peak season, and some of it is the 70¢ per gallon drop in diesel prices in the past two months. Those gains tend to be competed away in loose markets like 2022 within a few weeks but have held so far.

After a long downtrend in 2022, the recent bounce in spot rates and tightening in the spot/contract spread suggest a bottoming truckload rate cycle. This should turn the trajectory of freight markets in 2023, and the cycle is likely to enter yet another phase later in 2023.

One exciting feature of the new freight data partnership between ACT Research and DAT Freight & Analytics is that it helps us (ACT Research) elaborate on the truckload rate environment. In particular, we think the difference between spot and contract rates, or the spread, is very instructive for the near-term direction of contract rates in particular.

From the large spread, there is downward pressure on contract rates, which has been the case for much of the past year. But we also see the recent tightening of that spread as a key signpost of this new stage of the cycle, even green shoots of a new rate cycle. 


DAT TL Spot-Contract Spread


For more on why this is happening and what it means for the future of freight markets, the ACT Research Freight Forecast provides analysis and forecasts for a broad range of U.S. freight measures, including the Cass Freight Index, Cass Truckload Linehaul Index, and DAT spot and contract rates by trailer type. The service provides monthly, quarterly, and annual predictions for the TL, LTL, and intermodal markets over a two- to three-year time horizon, including capacity, volumes, and rates. The Freight Forecast is released monthly in conjunction with this report. 


Release date: We strive to release our indexes on the 12th of each month. When this falls on a Friday or weekend, our goal is to publish on the next business day.

Tim Denoyer head

About the Author: Tim Denoyer, ACT Research

Tim Denoyer joined ACT Research in 2017, after spending fifteen years in equity research focused primarily on the transportation, machinery, and automotive industries. Tim is a senior analyst leading ACT’s team transportation research effort, and the primary author of the ACT Freight Forecast, U.S. Rate and Volume Outlook. Research associate Carter Vieth, who joined ACT in early 2020 after graduating from Indiana University, also contributes to the report. This report provides supply chain professionals with better visibility on the future of pricing and volume in trucking, the core of the $1.06 trillion U.S. freight transportation industry, including truckload, less-than-truckload, and intermodal.

Tim also plays roles in ACT Research’s core Class 4-8 commercial vehicle data analysis and forecasting, in powertrain development, such as electrification analysis, and in used truck valuation and forecasting. Tim has supported or led numerous project-based market studies on behalf of clients in his four years with ACT Research on topics ranging from upcoming emissions and environmental regulations to alternative powertrain cost analyses to e-commerce and last-mile logistics to autonomous freight market sizing.

ACT’s freight research service leverages ACT’s expertise in the supply side economics of transportation and draws upon Tim’s background as an investment analyst, beginning at Prudential and Bear Stearns. Tim was a co-founder of Wolfe Research, one of the leading equity research firms in the investment industry. While with Wolfe, Tim was recognized in Institutional Investor’s survey of investors as a Rising Star analyst in both the machinery and auto sectors. His experience also includes responsibility for covering the industrial sector of the global equity markets, including with leading investment management company Balyasny Asset Management.

Disclaimer

The material contained herein is intended as general industry commentary. The Cass Freight Index, Cass Truckload Linehaul Index (“Indexes”), and other content are based upon information that we consider reliable, but Cass does not guarantee the accuracy, timeliness, reliability, continued availability or completeness of any information or underlying assumptions, and Cass shall have no liability for any errors, omissions or interruptions. Any data on past performance contained in the Indexes is no guarantee as to future performance. The Indexes and other content are not intended to predict actual results, and no assurances are given with respect thereto. Cass makes no warranty, express or implied. Opinions expressed herein as to the Indexes are those of Stifel and may differ from those of Cass Information Systems Inc. All opinions and estimates are given as of the date hereof and are subject to change.

Receive Index updates straight to your inbox