The Cass Shipments Index accelerated to 6.7% y/y growth in December 2020, nicely ahead of the 5.5% y/y increase predicted in this month’s ACT Freight Forecast report and accelerating from 2.7% y/y growth in November. The acceleration was partially explained by an easier prior year comparison, as the Cass Shipments Index rose 1.1% m/m from November on a seasonally adjusted (SA) basis. After a small sequential pullback in November, this acceleration brings us closer to the strong growth environment which we expect to continue in 2021. On a two-year stacked basis, the Cass Shipments Index was still 1.8% lower than December 2018, and even as y/y comps are set to accelerate considerably in the coming months, it will likely take some time for volumes to increase on this basis.
Chart: Cass Shipments Index, January 2009 – December 2020 (01’1990=1.00)
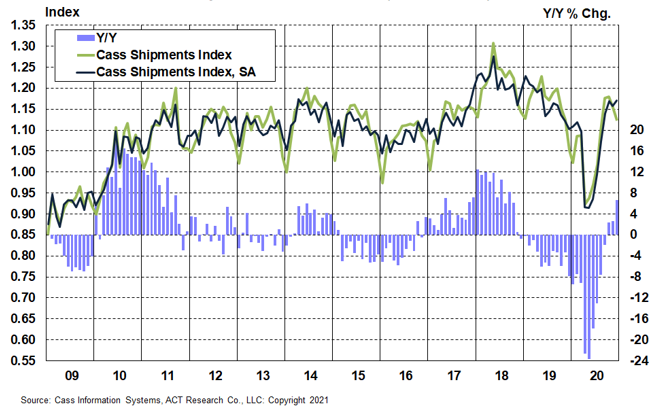
See the methodology for the Cass Freight Index.
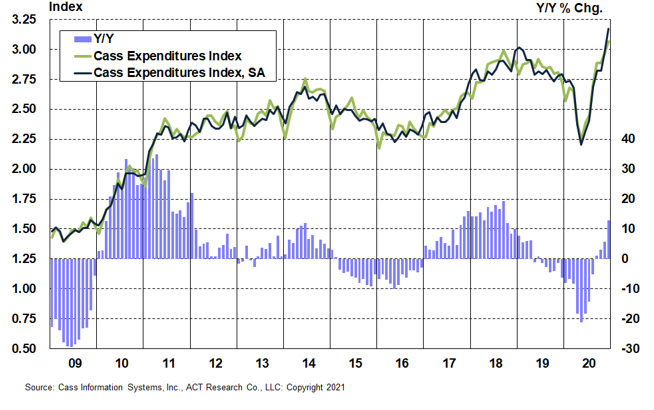
The Cass Expenditures Index reached a record high in December, accelerating to 13.0% y/y growth from 5.7% y/y growth in November. The acceleration was primarily due to higher rates, with the Cass Expenditures Index up 6.8% m/m on a seasonally adjusted basis, relative to the 1.1% increase in the Cass Shipments Index (SA). Freight rate increases continued to accelerate in December, and though spot freight rates had started to decelerate in late 2020, the market gapped higher following the latest round of federal stimulus signed 12/27/20. Though deceleration in spot rates has begun again as of mid-January, it is still safe to say that freight rates will broadly continue to accelerate in the near term.
Chart: Cass Expenditures Index, January 2009 – December 2020 (01’1990=1.00)
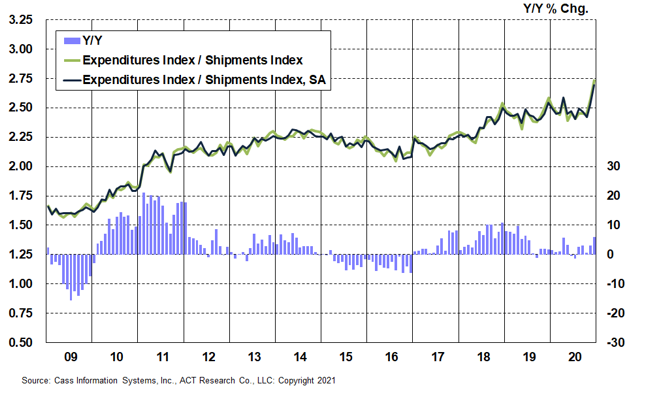
A simple calculation of the Cass Freight Index® data (expenditures divided by shipments) can give us an “implied freight rates” data set that explains the overall movement in rates. A positive implied freight rate indicates that expenditures grew more than shipments and rates have increased. Likewise, the opposite is true.
The freight rates embedded in the Cass Freight Indexes accelerated to a 6.0% y/y increase in December from a 3.0% y/y increase in November. This data series is diversified among all modes, with truckload representing more than half of the dollars, followed by rail, LTL, parcel, and so on. Based in part on spot trends, the acceleration in freight rates is likely to persist in the coming months.
Chart: Cass Implied Freight Rates, January 2009 – December 2020 (01’1990=1.00)
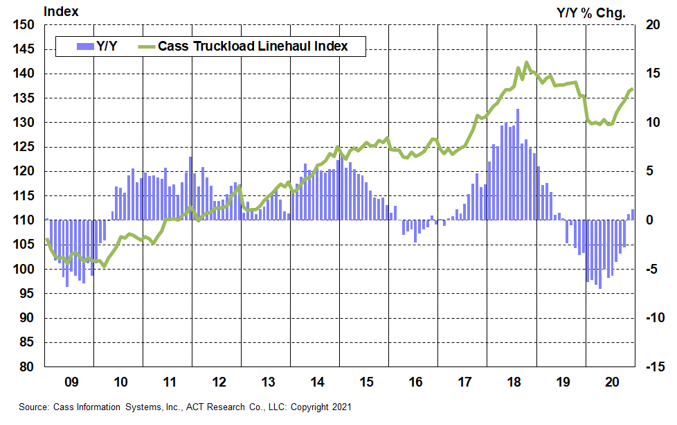
The Cass Truckload Linehaul Index® measures market fluctuations in per-mile truckload linehaul rates, independent of additional cost components such as fuel and accessorials. In December, the index accelerated modestly to a 1.1% y/y increase, after the first increase in fifteen months in November with a 0.6% y/y increase. On a m/m basis, the index rose 0.4% in December, following a 1.4% m/m increase in November. Freight rates are gaining steam, as also shown in the implied 6.0% y/y growth rate embedded in the Cass Freight Indexes noted above, and we expect the Cass Truckload Linehaul Index to continue to improve in the coming months.
Chart: Cass Truckload Linehaul Index®, January 2009 – December 2020 (01’1990=1.00)
See the methodology for the Cass Truckload Linehaul Index.
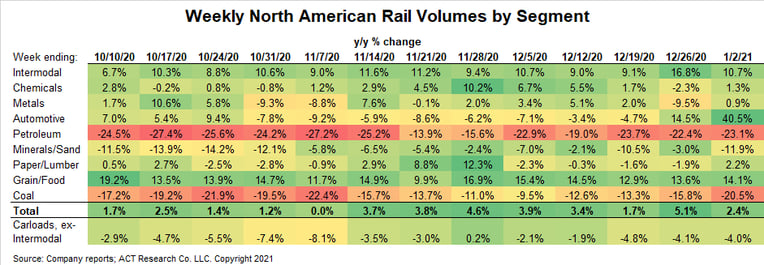
The improvement in the Cass Shipments Index is consistent with the generally improving trends in the railroad sector, where intermodal volumes had a very strong finish to 2020. With low inventory levels at U.S. retailers and a sharp reduction in blank sailings by global containership lines ahead of the 2/12-26 Chinese New Year holiday, the near-term pipeline of freight still looks quite strong from our perspective.
While near-term risks from the pandemic remain elevated, recently begun vaccinations will reduce these risks in the coming months.
Following the latest stimulus and the Senate outcome which makes more stimulus likely, ACT Research economists have raised our 2021 U.S. GDP growth forecast to 5.1%, following a 3.7% contraction in 2020. And though we expect the recovery to become more service-oriented over time (who else can’t wait to travel?), the slower-than-expected vaccine rollout and additional stimulus have increased our goods consumption expectations.
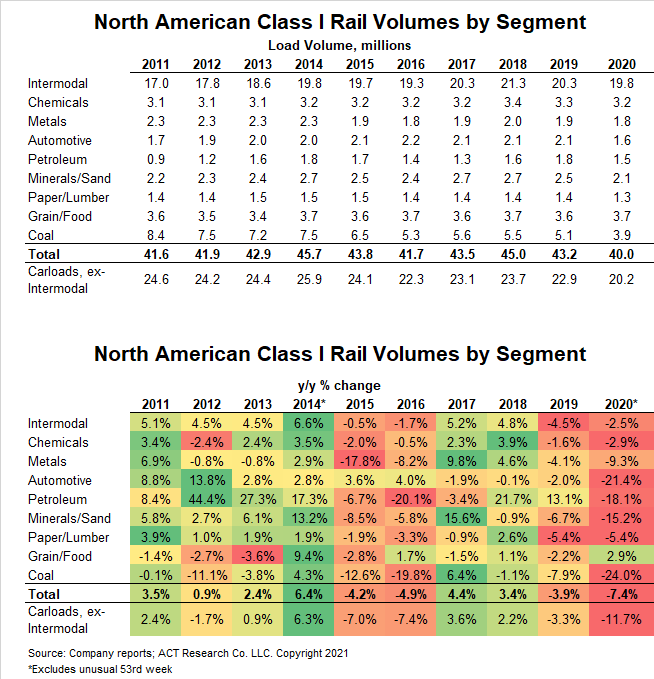
The current freight cycle, having started in May/June 2020, still has several powerful growth tailwinds following a nearly two-year freight downturn. As shown below, rail volumes reached a 10-year low in 2020, though they turned positive in Q4’20 with 2.5% y/y growth. With the Cass Expenditures Index reaching new record highs, the transition from an early-cycle environment to mid-cycle is underway.