The shipments component of the Cass Freight Index fell 4.4% y/y in April, but rose 0.4% m/m, building on a 10.4% m/m gain in February and a 3.0% gain in March.
In seasonally adjusted (SA) terms, shipments rose 0.6% m/m in the third straight gain, increasing the chances of a 2H recovery.
At the April SA rate, this index would rise 1.7% y/y in 2H’26.
LTL tonnage trends are improving for some fleets, which bodes well for continued improvement in shipment trends in the coming months. Tightness in the dry van TL market is starting to radiate to other modes, so far mainly reefer and flatbed TL, but eventually this tightness will drive demand in LTL and intermodal as well.
The normal seasonal trend would put the shipments component of the Cass Freight Index down just 1% y/y in May.
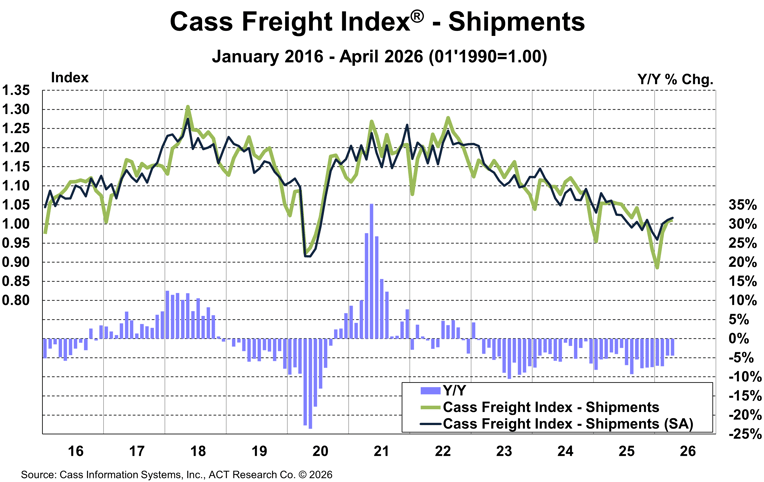
See the Methodology for the Cass Freight Index
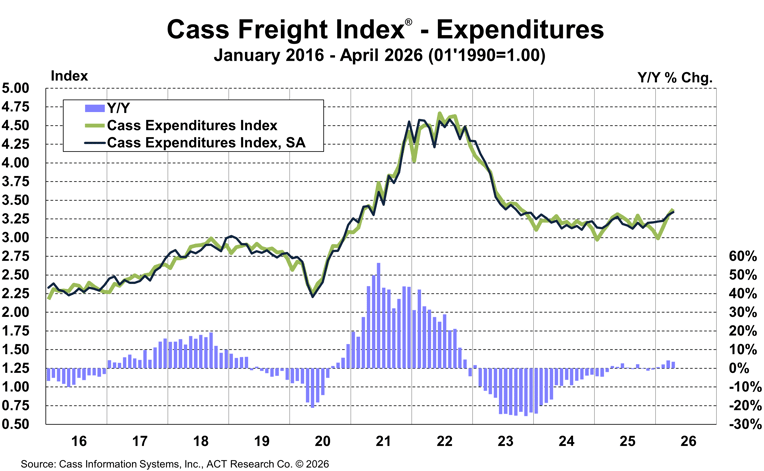
The expenditures component of the Cass Freight Index, which measures the total amount spent on freight, rose 3.5% y/y in April, slowing from 4.2% in March.
In SA terms, the index rose 1.2% m/m in April, after a 2.4% m/m increase in March.
After a record 38% surge in 2021 and another 23% increase in 2022, the expenditures component of the Cass Freight Index fell 19% in 2023 and 11% in 2024. In 2025, the index declined by 0.5%.
The Cass Truckload Linehaul Index rose 3.2% m/m in April, after a 0.5% decline in March.
After almost no m/m change in February and March, the Cass Truckload Linehaul Index rose 3.2% m/m in April, to a 5.6% y/y increase.
After a brief lull, TL rates have resumed their upward march, and are likely to continue in this direction with spot rates up 25% y/y in April. In our (ACT Research’s) view, an incipient driver shortage is a key factor behind the recent turn in market dynamics, among other capacity constraints.
This index reflects the whole for-hire market, both spot and contract rates.
The Cass Truckload Linehaul Index fell 10% in 2023, another 3.4% in 2024, and turned up to a 1.8% increase in 2025.
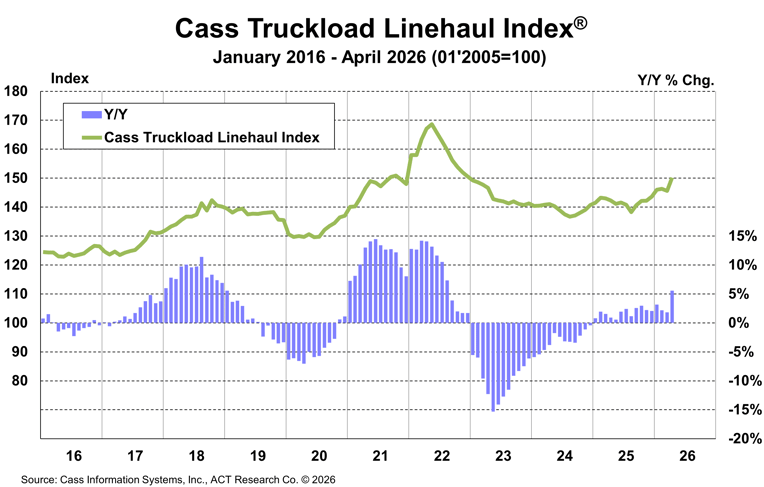
See the Methodology for the Cass Truckload Linehaul Index

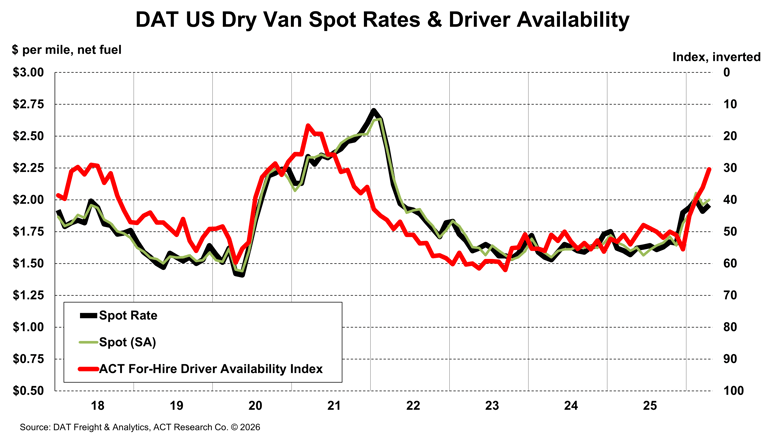
A supply-driven freight cycle doesn’t imply strong volumes, and with higher fuel prices sapping consumer spending, and rising interest rates sapping the housing market, this time is no different. Improving survey data, including a jump in the ACT For-Hire Volume Index, suggest our friends at medium and large dry van and reefer fleets are beginning to see significantly stronger demand, even as the broader market does not. The source of this early demand increase is primarily capacity reduction, which has accelerated this year due to an incipient driver shortage.
While the goods economy is providing little lift, the key question becomes, how bad will the driver situation get? In a word, worse. Truckload spot rates have risen materially in recent months as the ACT For-Hire Driver Availability Index has declined. This index was above 50, meaning a surfeit, rather than a shortage, from June 2022 to December 2025, 43 straight months. It fell to 30.4 in April. New FMCSA regulations have acted as a catalyst, and seem likely to result in tighter capacity and higher rates from here.
The ACT Research Freight Forecast provides three-year forecasts for freight volumes and rates in the U.S. and Canada. This service provides in-depth analysis and forecasts for a broad range of U.S. freight measures, including ACT Class 8 tractor sales, the Cass Freight Index, Cass Truckload Linehaul Index, DAT spot and contract rates by trailer type, LTL, and intermodal rates and volumes. We provide monthly, quarterly, and annual predictions for over forty data series over a two- to three-year time horizon, including capacity, volumes, and rates. The ACT Research Freight Forecast is released monthly in conjunction with the Cass Transportation Index report.
The ACT Research Freight Forecast now predicts 83 distinct data series covering TL, LTL, and intermodal volumes and rates. Please see this one-page monthly summary, from nearly three years ago. While it should no longer be relied upon, we think it will help you understand why our supply-side perspective is helpful for planning, strategy, and forecasting.
(As a reminder, ACT Research’s Tim Denoyer writes this report.)
Release date: We strive to release our indexes on the 13th of each month. When this falls on a Friday or weekend, our goal is to publish on the next business day.

