Cass Transportation Index Report April 2022

Get the most up-to-date data and insights into shipping volumes and the cost of freight. See how they change each month and understand the market forces behind them.

SubscribeDownload Historical Data Points (xls)

Into the Woods

  April 2022 Year-over-year change 2-year stacked change Month-to-month change Month-to-month change (SA)
Cass Freight Index - Shipments 1.172 -0.5% 27.0% -2.6% -3.5%
Cass Freight Index - Expenditures 4.510 30.6% 89.6% 0.2% -2.0%
Cass Inferred Freight Rates 3.848 31.3% NA 2.9% 1.6%
Truckload Linehaul Index* 167.1 14.1% 28.9% 2.3% 2.3%


Cass Freight Index - Shipments

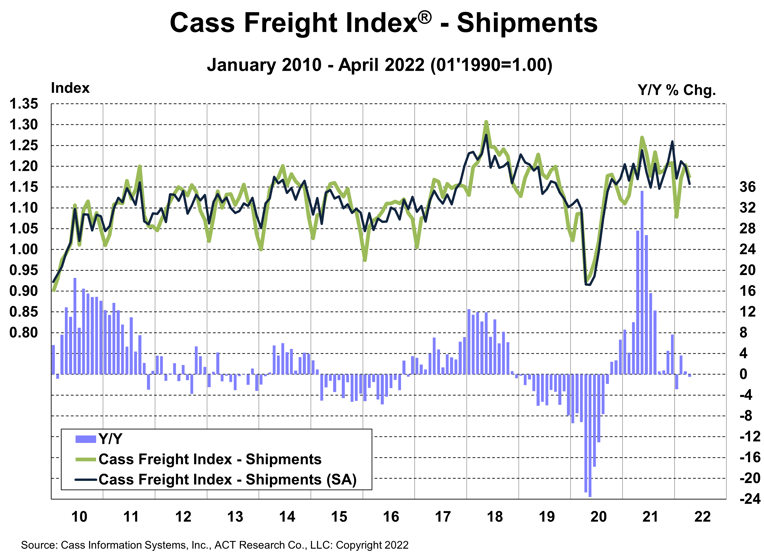
U.S. freight volumes fell in April from March and the year-ago period. And with more difficult comparisons in the next few months as global supply chain disruptions are set to intensify, more softness is on the horizon.

The shipments component of the Cass Freight Index fell 0.5% y/y, following a 0.6% y/y increase in March.

  • The shipments component of the Cass Freight Index fell 2.6% from March, and this was 0.9% below the normal seasonal pattern.
  • Freight was slowing even before the war in Europe began, but the effects of the additional surge of inflation and recent interest rate increases seem to have push volumes over the edge.
  • After a nearly two-year cycle of surging freight volumes, the freight cycle has downshifted with a thud. It’s possible the April data include some indirect impact from lockdowns in China, but with container ship backlogs still off North American ports, the direct effects on finished goods imports seem more likely in the June/July timeframe.
  • The prospect of freight recession is now considerable, as substitution from goods back to services spending picks up pace, and as inflation slows overall spending, particularly via higher fuel prices and by pressing up interest rates.


Cass Freight Index Shipments April 2022


See the methodology for the Cass Freight Index.


Cass Freight Index - Expenditures

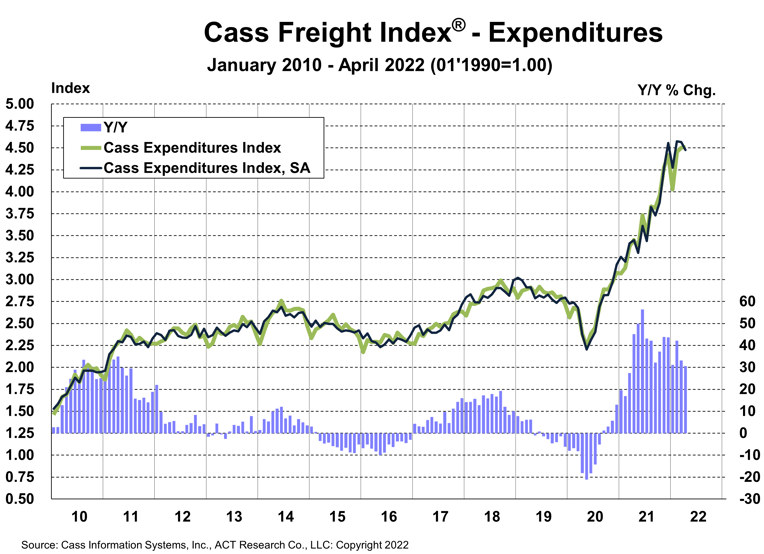
The expenditures component of the Cass Freight Index, which measures the total amount spent on freight, rose 0.2% m/m in April against a shipment decline of 2.6%. Compared to a year ago, total freight expenditures were up 31% y/y. Overall rates were up 2.9% (see Freight Rates, below).

  • On a seasonally adjusted basis, expenditures fell 2.0% m/m while shipments fell 1.0% m/m. Rates are still creeping higher.
  • The two-year stack compares against the worst of the pandemic shutdown, so it isn’t very meaningful, but the Expenditures component of the Cass Freight Index was up 90% over April 2020, with shipments up 27% and rates up 49%.

This index rose 38% in 2021, after a 7% decline in 2020 and no change in 2019. Tougher comparisons in the coming months will naturally slow these y/y increases, but just using normal seasonality from here, the increase in 2022 will still be about 24%.


Cass Freight Index Expenditures April 2022


Inferred Freight Rates

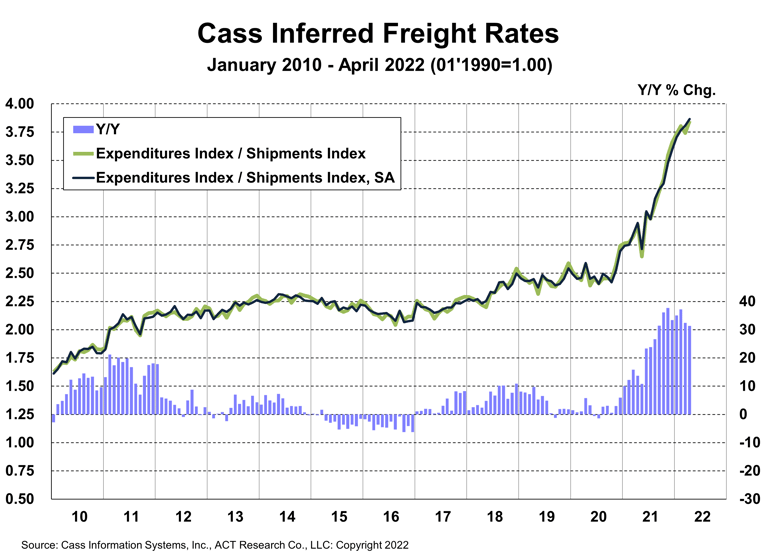
The freight rates embedded in the two components of the Cass Freight Index slowed to a 31% y/y increase in April from 32% in March.

  • Cass Inferred Freight Rates rose 1.5% m/m on a seasonally adjusted basis in April, setting another new record, but this was likely mainly on fuel surcharges.

These rates are representative of the industry’s mix of contract and spot rates, but spot rates have turned sharply lower ex-fuel recently in the more real-time spot markets. Though these rates are all-in, in contrast to the Cass Truckload Linehaul Index which excludes fuel and accessorials, this signals significant deceleration in the next six months, even assuming higher fuel costs persist.

Significant risks remain, such as new COVID variants, and equipment capacity remains limited and could tighten further if the Russia/Ukraine war worsens the chip shortage. But 2022 has featured big improvement in driver availability and slowing of freight demand. This is a deflationary combination, though it will take several months to filter from the spot market into contract rates.

There have been tentative signs of recovering intermodal network fluidity as chassis production continues to accelerate and brisk hiring continues. But intermodal volumes continue to underperform the shipments component of the Cass Freight Index, and rail network congestion continues to add to Cass Inferred Freight Rates via excess miles in the freight network.

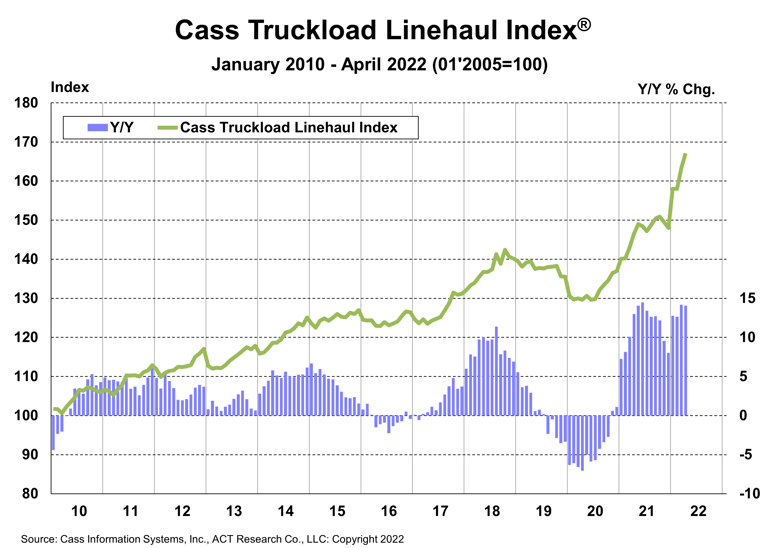
Excess miles, rising fuel surcharges, and accessorial fees are all factors excluded from the Cass Truckload Linehaul Index, so the true increase in freight cost, depending on how these factors shake out, is between the 14% y/y increase in the Cass Truckload Linehaul Index and the 31% y/y increase in the inferred rate.

Freight rates rose 23% in 2021. The normal seasonal pattern from here would suggest some acceleration this year, and it is likely to accelerate next month on an easy comparison, but we would expect a slower full-year rate change.

Cass Inferred Freight Rates are a simple calculation of the Cass Freight Index data, expenditures divided by shipments, producing a data set that explains the overall movement in cost per shipment. The data set is diversified among all modes, with truckload representing more than half of the dollars, followed by LTL, rail, parcel, and so on.


Cass Inferred Freight Rates April 2022


Download the data

Truckload Linehaul Index

The Cass Truckload Linehaul Index® rose 14.1% y/y in April to 167.1 after rising 14.2% y/y in March.

  • While truckload rates have had an extraordinary cycle, the key leading indicators have fallen sharply over the past few months, which we expect to limit further upside in the Cass Truckload Linehaul Index and change its trajectory over the course of the year.
  • Normal contract timing would suggest there’s room for this index to continue to rise for a little longer after the peak in spot rates, but the clock is ticking.


Cass Truckload Linehaul Index April 2022


See the methodology for the Cass Truckload Linehaul Index.


Freight Expectations

As recently as the start of this year, pricing power in the truckload market was firmly with fleets. After nearly two years in this position, the concept of the pricing power pendulum almost seemed obsolete to many. Until it swung and cratered rates. Once a pendulum gets going, it’s very hard to stop.

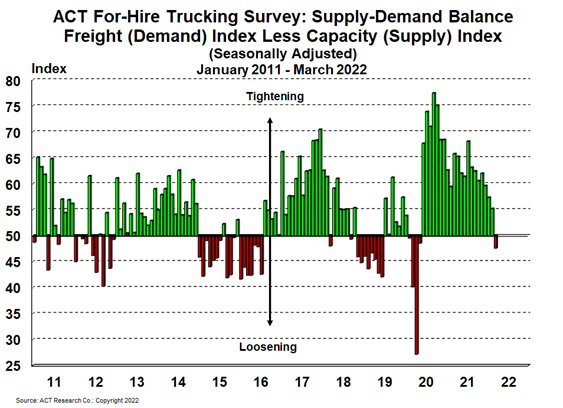
Not coincidentally, the Supply-Demand Balance in ACT Research’s for-hire survey turned loose this month, for the first time since June 2020, as the rebalancing, drawn-out by the pandemic, hit critical mass.


ACT Freight Supply-Demand Balance March 2022


The combination of inflation, Fed monetary tightening, war in Europe, and substitution back to services from goods are all leading to a downshift in the freight cycle. And consistent with the fundamental reason for cyclicality in the freight sector, the capacity response is occurring just as the surge in demand is ebbing.

While this will be good news to some, including shippers and those anxious about broader inflation, it is a sign for fleets to batten the hatches. Far from stagflation, these dynamics strongly suggest freight rate deflation is on the horizon.


If you rely on freight data to run your business, you may want to take a look at the ACT Freight Forecast report, which provides monthly predictions for the TL, LTL and intermodal markets, including capacity, volumes and rates, and forecasts for the shipments component of the Cass Freight Index and the Cass Truckload Linehaul Index through 2024.


Release date: We strive to release our indexes on the 12th of each month. When this falls on a Friday or weekend, our goal is to publish on the next business day.

Tim Denoyer head

About the Author: Tim Denoyer, ACT Research

Tim Denoyer joined ACT Research in 2017, after spending fifteen years in equity research focused primarily on the transportation, machinery, and automotive industries. Tim is a senior analyst leading ACT’s team transportation research effort, and the primary author of the ACT Freight Forecast, U.S. Rate and Volume Outlook. Research associate Carter Vieth, who joined ACT in early 2020 after graduating from Indiana University, also contributes to the report. This report provides supply chain professionals with better visibility on the future of pricing and volume in trucking, the core of the $800 billion U.S. freight transportation industry, including truckload, less-than-truckload, and intermodal.

Tim also plays roles in ACT Research’s core Class 4-8 commercial vehicle data analysis and forecasting, in powertrain development, such as electrification analysis, and in used truck valuation and forecasting. Tim has supported or led numerous project-based market studies on behalf of clients in his four years with ACT Research on topics ranging from upcoming emissions and environmental regulations to alternative powertrain cost analyses to e-commerce and last-mile logistics to autonomous freight market sizing.

ACT’s freight research service leverages ACT’s expertise in the supply side economics of transportation and draws upon Tim’s background as an investment analyst, beginning at Prudential and Bear Stearns. Tim was a co-founder of Wolfe Research, one of the leading equity research firms in the investment industry. While with Wolfe, Tim was recognized in Institutional Investor’s survey of investors as a Rising Star analyst in both the machinery and auto sectors. His experience also includes responsibility for covering the industrial sector of the global equity markets, including with leading investment management company Balyasny Asset Management.

Disclaimer

The material contained herein is intended as general industry commentary. The Cass Freight Index, Cass Truckload Linehaul Index (“Indexes”), and other content are based upon information that we consider reliable, but Cass does not guarantee the accuracy, timeliness, reliability, continued availability or completeness of any information or underlying assumptions, and Cass shall have no liability for any errors, omissions or interruptions. Any data on past performance contained in the Indexes is no guarantee as to future performance. The Indexes and other content are not intended to predict actual results, and no assurances are given with respect thereto. Cass makes no warranty, express or implied. Opinions expressed herein as to the Indexes are those of Stifel and may differ from those of Cass Information Systems Inc. All opinions and estimates are given as of the date hereof and are subject to change.

Receive Index updates straight to your inbox