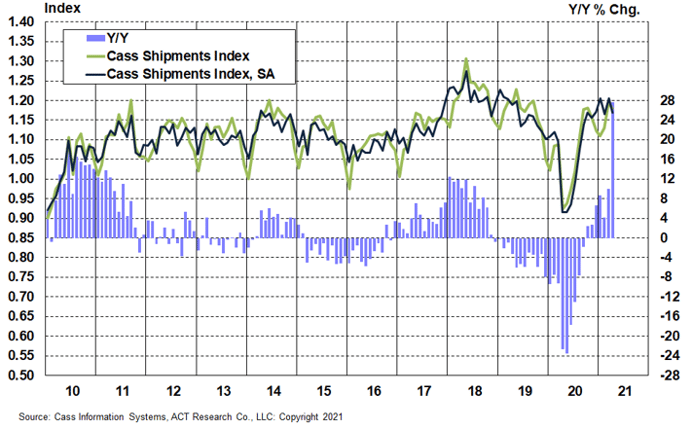
The shipments component of the Cass Freight Index® grew at a record 27.6% y/y pace in April, accelerating from a 10.0% y/y increase in March. While it has never risen this much on a y/y basis, the only past declines as large as during the economic quarantine of Q2’20 were during the 2008-2009 financial crisis. So, the pandemic recovery is progressing considerably faster than the recovery from the Great Recession, when y/y growth peaked at 18.5% in mid-2010.
Yet, this strong acceleration was expected because it was more than explained by the easier comparison against the Q2’20 pandemic shutdown. On a seasonally adjusted (SA) basis, the Cass Shipments Index fell 3.1% m/m from March to April, giving back most of the 3.4% m/m (SA) increase in March.
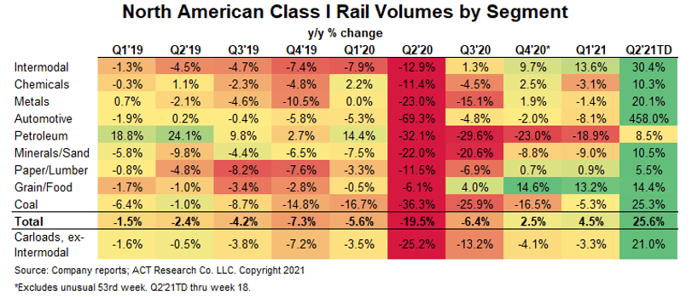
While some of the March m/m increase was make-up from activity lost during the polar vortex in February, our sense is the April m/m decline was due more to ongoing supply constraints and the deepening semiconductor shortage, which resulted in considerable downtime in auto and truck manufacturing in April. On the Class I railroads, motor vehicle carloads fell about 20% from March to April. Near-term supply chain risks remain, with constrained chip supply unlikely to be fully resolved quickly as lead times on new semiconductor manufacturing capacity are generally about 18- 24 months.
Chart: Cass Shipments Index, January 2010 – April 2021 (01’1990=1.00)
See the methodology for the Cass Freight Index.
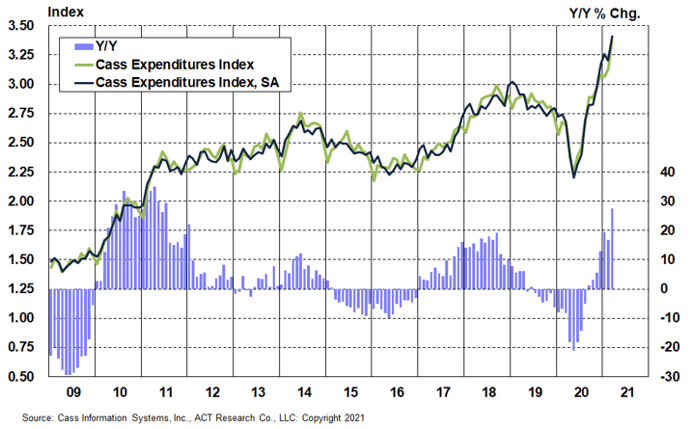
The Cass Expenditures Index set another new record in April, its fourth in five months, and was 45.1% above the year-ago level, surging from 27.5% y/y growth in March.
On a seasonally adjusted basis, the Cass Expenditures Index rose 1.1% from March, and with volumes a bit softer m/m, the increase was more than explained by higher embedded rates, which rose 3.4% m/m.
On normal seasonal patterns, the easier comparisons would suggest y/y growth at or above 50% in May and June, then slowing to more like 30% y/y growth rates in Q3.
Chart: Cass Expenditures Index, January 2009 – April 2021 (01’1990=1.00)
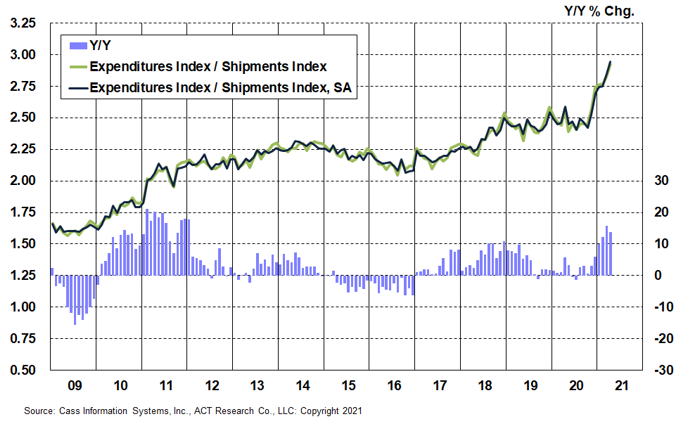
A simple calculation of the Cass Freight Index data (expenditures divided by shipments) produces a data set of “implied freight rates” that explains the overall movement in rates.
The freight rates embedded in the two components of the Cass Freight Index slowed to a 13.7% y/y increase in April from a 15.8% y/y increase in March. This y/y slowdown was due to a tougher prior year comparison, which may have been due to unusual changes in mix in the April 2020 shutdown period.
The embedded rates rose another 3.4% m/m on a seasonally adjusted basis in April, following a 3.5% m/m increase in March consistent with the rising trend of the past five months. With much of the annual contract freight market repriced at this point, we expect these increases to begin to slow near-term. However, with strong freight demand and supply constraints on both drivers and trucks, spot and contract rates should continue to rise.
This data series is diversified among all modes, with truckload representing more than half of the dollars, followed by rail, LTL, parcel, and so on.
Chart: Cass Implied Freight Rates, January 2009 – April 2021 (01’1990=1.00)
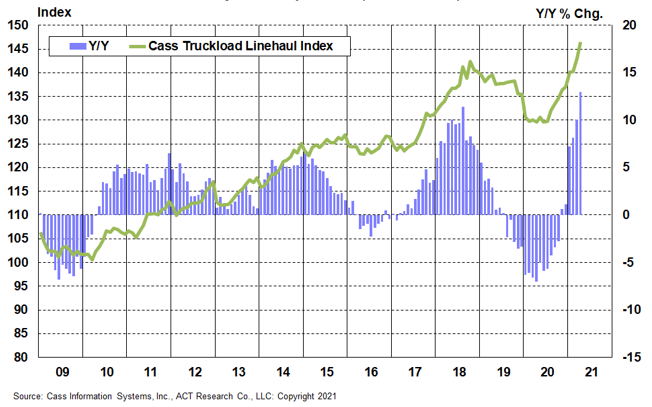
The Cass Truckload Linehaul Index® value of 146.5 in April represented a second-straight all-time record and accelerated to a 13.0% y/y increase from a 10.1% y/y increase in March. On a m/m basis, the seasonally adjusted index was 2.4% higher than March, in the tenth straight increase.
With strong freight demand and major supply constraints in both of the critical components of trucking capacity – drivers and tractors – the near-term trend of the Cass Truckload Linehaul Index should remain up and to the right. Driver challenges continue to mount, as discussed below, and the annual Road Check law enforcement event in early May was a factor in pressing spot truckload rates even higher. Meanwhile, parts shortages continue to limit truck production and keep the truckload market tight.
Chart: Cass Truckload Linehaul Index®, January 2009 – April 2021 (01’1990=1.00)
See the methodology for the Cass Truckload Linehaul Index.
Even with considerable supply constraints, the freight cycle is essentially in full swing as all components of the Cass indexes, with the exception of the Cass Shipments Index, posted new record highs again this month. With tailwinds from a very strong retail economy, a backlog of containerships still anchored in the San Pedro Bay and inventories recovering but still tight, 2021 is setting up to be an extraordinarily strong year of recovery across the U.S. freight network.
Since the strong rebound in early March from the polar vortex, rail trends have continued modestly above normal seasonal patterns, but Q2’21 acceleration in the y/y data below is mostly due to easier prior year comparisons. Similar to the Cass Freight Index data, rail volumes will show extraordinary y/y growth in the coming months. Trucking appears to be experiencing a similar pattern, and with 25%-30% y/y increases in the next few months against the economic shutdown period in Q2 of last year, the sequential, seasonally adjusted data will be more informative on the longer-term trend in the coming months.
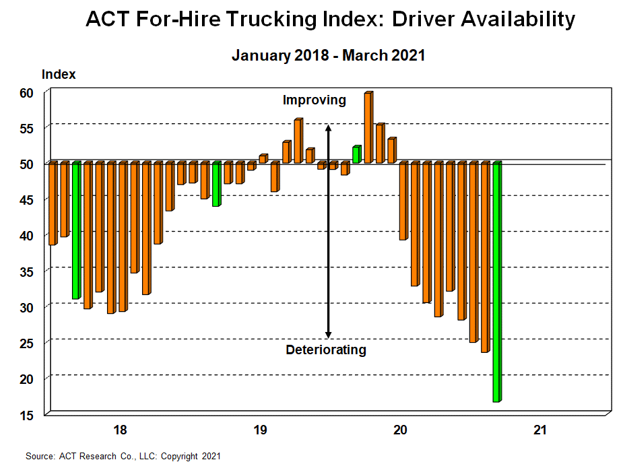
In addition to strong demand and ongoing equipment supply chain shortages, the driver shortage is a major factor in the freight market equation. While it’s a complex issue, discussed in depth in the ACT Freight Forecast report, the record low driver availability has perhaps played an even larger role in driving freight rates to record levels recently than the truck production challenges.
When asked about the factors behind the extraordinarily challenging driver availability situation, fleet executives we talk with list:
But with enough time, the cure for high prices is high prices. Check out the ACT Freight Forecast for data-driven predictions for supply, demand, and the rate cycle in the truckload, LTL, and intermodal markets over a three-year planning horizon. While taking seasonality into account, these forecasts consider several crucial variables, including freight market conditions, economic conditions, inventory levels, and supply side factors.

