The shipments component of the Cass Freight Index® slowed to just 0.6% y/y growth in September.
The softening in September fits the pattern of many data sets, like rail volumes and employment, and we’d ascribe some of the softness to Hurricane/Tropical Storm Ida. This suggests some rebound in Q4, but the chip shortage also worsened in September, and that recovery will take longer.
Freight volumes also remain capacity-constrained, as shown by the armada of containerships at anchor off North American ports. Signs are emerging that rail network congestion is improving, which could help things unlimber a bit, but we think intermodal volumes will be limited by chassis tariffs for some time.
Chart: Cass Shipments Index, January 2010 – September 2021 (01’1990=1.00)
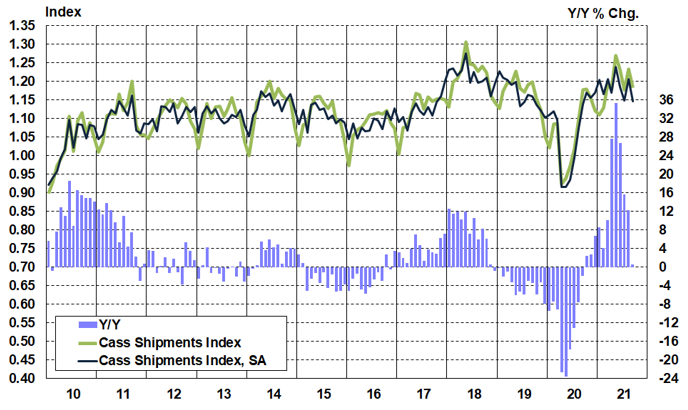
Source: Cass Information Systems, Inc, ACT Research Co., LLC. (c) 2021
See the methodology for the Cass Freight Index.
To access forecasts of the shipments component of the Cass Freight Index® and the Cass Truckload Linehaul Index® through 2023, subscribe to the ACT Research Freight Forecast report.
The expenditures component of the Cass Freight Index measures the total amount spent on freight, which rose 32% y/y in September. This index slowed from 42% growth in August, largely on tougher prior-year comparisons. If normal seasonality were to play out for the rest of this year, the full-year increase in this index would be 34% in 2021, after a 7% decline in 2020 and no change in 2019.
Tougher comparisons in the coming months will naturally slow these y/y increases further, but normal seasonality implies a 25% y/y growth rate in Q4.
Chart: Cass Expenditures Index, January 2010 – September 2021 (01’1990=1.00)
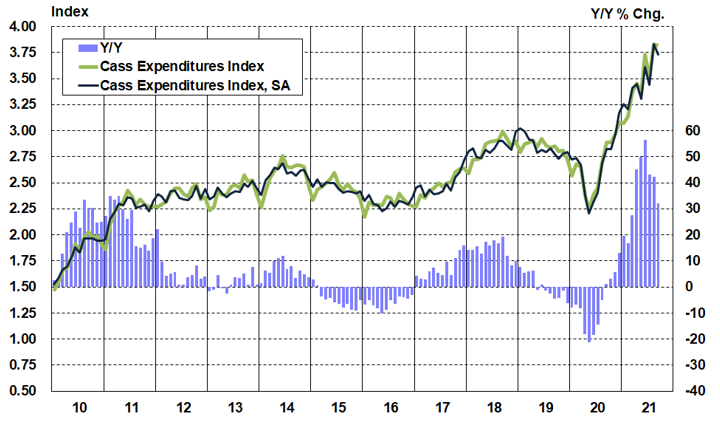
Source: Cass Information Systems, Inc, ACT Research Co., LLC. (c) 2021
A simple calculation of the Cass Freight Index data (expenditures divided by shipments) produces a data set of inferred freight rates that explains the overall movement in rates.
Though difficult to quantify, there are a lot of excess miles in the system due to all of the supply chain disruptions in the shortage economy of 2021. Examples include containers being offloaded at small remote ports to attempt to avoid the backlogs in LA and Long Beach, and chassis shortages pushing freight from the congested rail network onto truckload, considerably raising the length of haul in the largest freight market.
These excess miles are part of the 31.4% y/y increase in inferred freight rates, because, as noted in the calculation above, these rates are on a per shipment basis, rather than a per mile basis. But the difference between the increase in overall inferred freight rates (2.6% m/m) and the Cass Truckload Linehaul Index® (1.1% m/m) also includes higher fuel surcharges, sharper increases in air cargo rates, and mix shifts between modes, with a smaller proportion of low-cost intermodal and rail, and a larger proportion of relatively higher-cost air and refrigerated truckload.
Moreover, these data show broad and material increases in freight rates across modes. For full-year 2021, if normal seasonality were to play out, this index would be up about 20% from 2020.
The data set is diversified among all modes, with truckload representing more than half of the dollars, followed by LTL, rail, parcel, and so on.
Chart: Cass Inferred Freight Rates, January 2010 – September 2021 (01’1990=1.00)
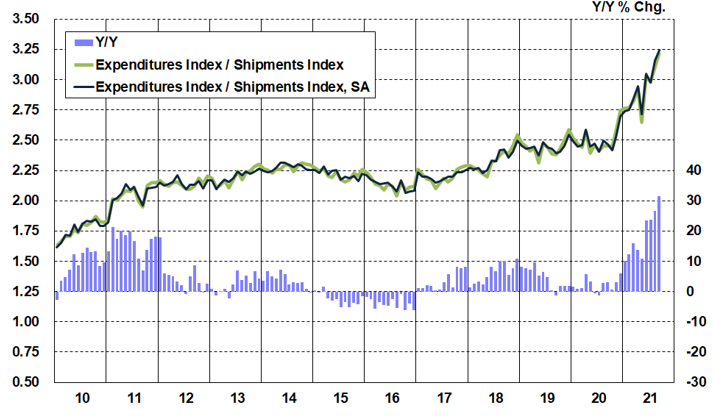
Source: Cass Information Systems, Inc, ACT Research Co., LLC. (c) 2021
The Cass Truckload Linehaul Index® value of 150.4 in September rose 1.1% from August, setting a new record. On a y/y basis, the index rose 12.7%, in line with the 12.6% increase in August. Based on inflationary effects from the COVID-19 Delta variant, Hurricane Ida, and chip shortages, to name a few, and now risk related to vaccine mandates which could disturb the fragile driver recovery, we would still expect this index to trend higher near-term.
Longer-haul mix related to intermodal chassis shortages pushing more freight off the rails and into West Coast to Midwest truckload lanes is continuing to pressure these data.
Freight demand is clearly still strong, and supply challenges continue to mount, keeping upward pressure on rates.
The gradual easing of supply constraints for critical components of trucking capacity–drivers and equipment–will continue to be key to the longer-term outlook. This should change the trajectory of the Cass Truckload Linehaul Index over the next year, just not quite yet.
Chart: Cass Truckload Linehaul Index®, January 2010 – September 2021 (01’1990=1.00)
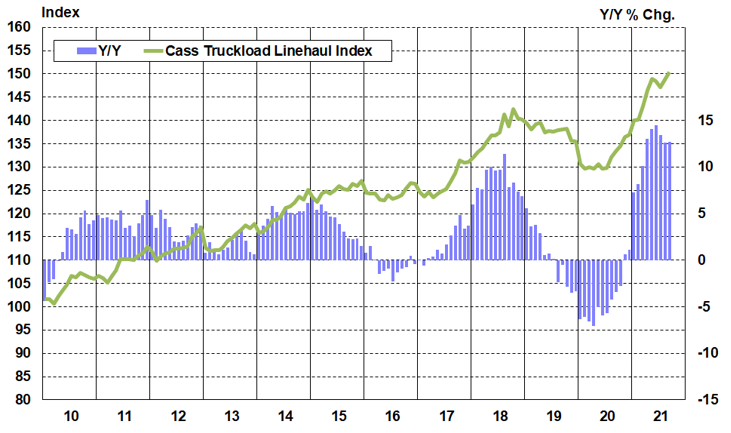
Source: Cass Information Systems, Inc, ACT Research Co., LLC. (c) 2021
See the methodology for the Cass Truckload Linehaul Index.
A skeptic might look at flattish volume and record rate increases and shout “stagflation!”, but we would disagree. Freight demand is anything but stagnant, and has been caged by supply constraints, which are likely peaking with the season.
The extent to which constraints on equipment and driver supply ease in the coming months will largely dictate volume and rate trends. Intermodal volumes have been inching up sequentially in recent weeks as chassis turns improve, and China’s power outages will likely impact exports, so the containership backlog should ease in the coming months. Still, a low inventory/sales ratio and an early Chinese New Year in 2022 starting on February 1st support strong import demand in early 2022.
Eventually, improving driver and equipment capacity will help rebalance the market, but several recent factors, including Hurricane Ida, the Delta variant, and the chip and chassis shortages have been inflationary for freight rates, extending the cycle at the margin.
Vaccine mandates and a closed loophole in the FMCSA Drug & Alcohol Clearinghouse are new inflationary risks this month and will challenge the driver recovery, as discussed in depth in this month’s ACT Research Freight Forecast report. This report also forecasts the shipments component of the Cass Freight Index and the Cass Truckload Linehaul Index through 2023.
Freight demand fundamentals remain strong, based on a strong U.S. consumer balance sheet, inventory restocking, and an industrial sector struggling to grow into record orders with infrastructure stimulus likely on the way.
But the dynamics of tight supply and exceptionally strong demand which have characterized the past year or so will not last indefinitely. The chip shortage continues to be a key fulcrum on which much in the world economy depends. As discussed in depth in ACT’s monthly report, there’s good reason to hope easing will start in Q4.
Release date: We strive to release our indexes on the 12th of each month. When this falls on a Friday or weekend, our goal is to publish on the next business day.

