Cass Transportation Index Report August 2022

Get the most up-to-date data and insights into shipping volumes and the cost of freight. See how they change each month and understand the market forces behind them.

SubscribeDownload Historical Data Points (xls)

The Slowing in Rates Quickens

  August  2022 Year-over-year change 2-year stacked change Month-to-month change Month-to-month change (SA)
Cass Freight Index - Shipments 1.278 3.6% 16.3% 6.6% 5.5%
Cass Freight Index - Expenditures 4.614 20.4% 71.2% 1.9% 2.1%
Cass Inferred Freight Rates 3.610 16.3% NA -4.4% -3.2%
Truckload Linehaul Index 159.74 7.4% 20.9% -1.8% --


Cass Freight Index - Shipments

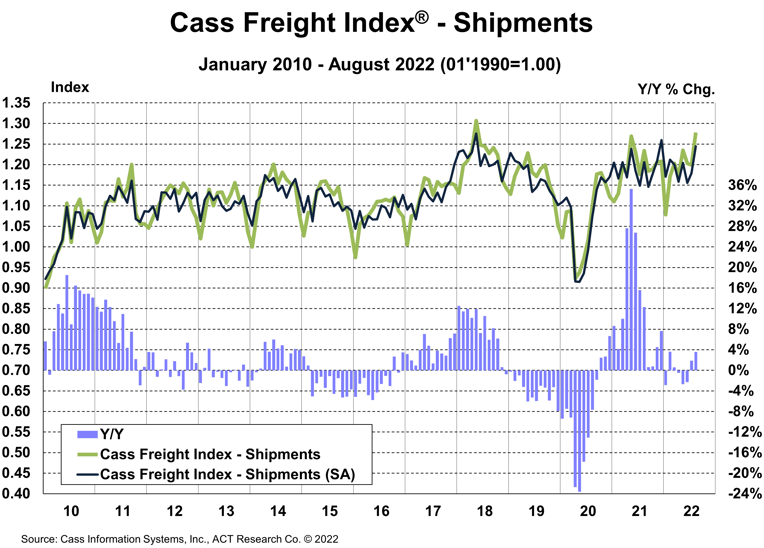
The shipments component of the Cass Freight Index® rose 3.6% on a y/y basis in August, ahead of the revised 1.9% y/y increase in July and the -0.3% average year-to-date through July. The August reading is the best since the record set in May 2018.

The July index is revised to 1.199 from 1.182.

  • On a seasonally adjusted (SA) basis, shipments rose 5.5% m/m in August, and were just 1.2% below the cycle peak level in December 2021.
  • This data set stands above most other August freight indicators, but several of the soft August indicators are from the spot market. So, to some extent, the stronger Cass data reflect the ongoing shift from spot to contract.
  • The improvement may not be sustainable, especially as pressure increases on interest rate sensitive sectors like capital goods and housing, but the summer improvement likely reflects a combination of:
    • successful discounting campaigns by retailers,
    • seasonal inventory building ahead of the holidays,
    • easing supply constraints, particularly in auto production, and
    • reversal of China lockdown effects in June/July.


Cass Shipments Index August 2022


See the methodology for the Cass Freight Index.


Cass Freight Index - Expenditures

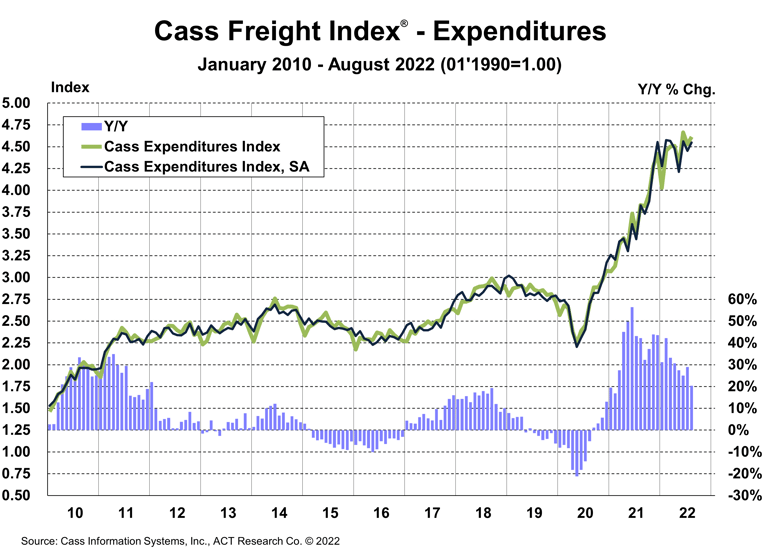
The expenditures component of the Cass Freight Index®, which measures the total amount spent on freight, rose 1.9% m/m in August after a 3.0% decline in July, with shipments up 6.6% and rates down 4.4%.

The July index is revised to 4.527 from 4.499.

  • The Cass Expenditures Index was still 20% higher than year-ago levels in August, decelerating from 29% in July.
  • On an SA basis, expenditures rose 2.1% m/m in August, with shipments up 5.5% m/m and rates down 3.2%.

We estimate roughly 7pps-8pps of the y/y increase in the expenditures index is currently due to fuel prices alone, and part of the m/m decline in rates was due to lower fuel prices. This index includes changes in fuel, modal mix, intramodal mix, and accessorial charges.

Simply following normal seasonality from here, this index is on track for a 24% increase in 2022 and would turn down on a y/y basis next February.


August 2022 Cass Expenditures Index


Inferred Freight Rates

The freight rates embedded in the two components of the Cass Freight Index rose 16% y/y in August, decelerating quickly from the 26% y/y increase in July.

  • Cass Inferred Freight Rates fell 4.4% m/m (-3.2% SA) in August. Lower fuel prices were a factor in the decline, but with looser truckload market conditions, further deceleration is very likely.

With the tight supply/demand balance in U.S. trucking markets easing considerably this year, industry rates are topping out and set to slow sharply in the months to come.

While shippers aren’t seeing any real savings yet, such relief is now highly probable for 2023, which is welcome news for the broader inflation picture.


August 2022 Cass Inferred Freight Rates


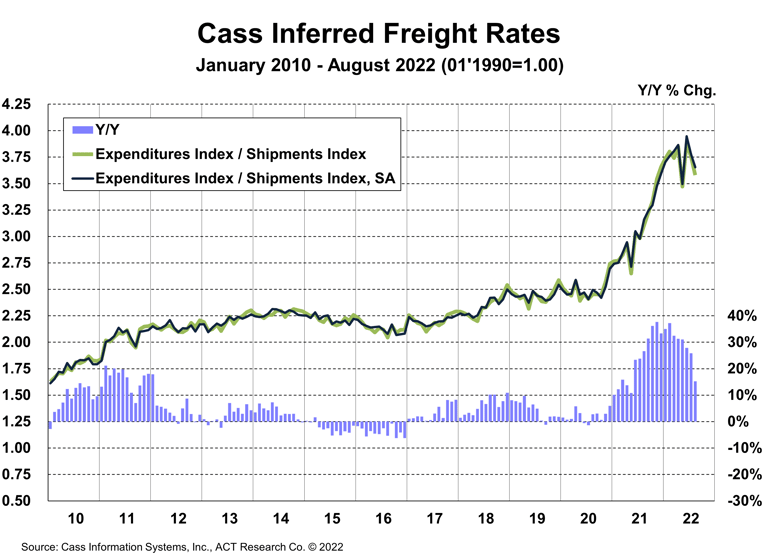
Cass Inferred Freight Rates are a simple calculation of the Cass Freight Index data, expenditures divided by shipments, producing a data set that explains the overall movement in cost per shipment. The data set is diversified among all modes, with truckload representing more than half of the dollars, followed by LTL, rail, parcel, and so on.


Download the data

Truckload Linehaul Index

The Cass Truckload Linehaul Index® rose 7.4 y/y in August to 159.7, after rising 10.5% y/y in July.

  • On a m/m basis, the Cass Truckload Linehaul Index fell 1.8%, similar to the declines in June and July. The clarity of the trend change in the past three months is rather stunning: after a 22-month cycle of increases that averaged 1.2% per month, the index fell m/m 1.76%, 1.78%, and 1.83% respectively in June, July, and August.
    • We’ve consistently previewed this trend change, so it shouldn’t be a surprise, but the stunning part is the consistency in the three consecutive 1.8% declines—enough to make us look out to the hundredths of a percent.
    • This index excludes fuel and accessorial charges, so when factoring in sequential declines in fuel surcharges, which should continue near term, the deceleration in freight costs is accelerating.
  • Similar to what has occurred in the spot market, the surge in fuel costs to shippers, which are excluded from this index, will also likely act as a brake on linehaul rates.


August 2022 Cass Truckload Linehaul Index-1


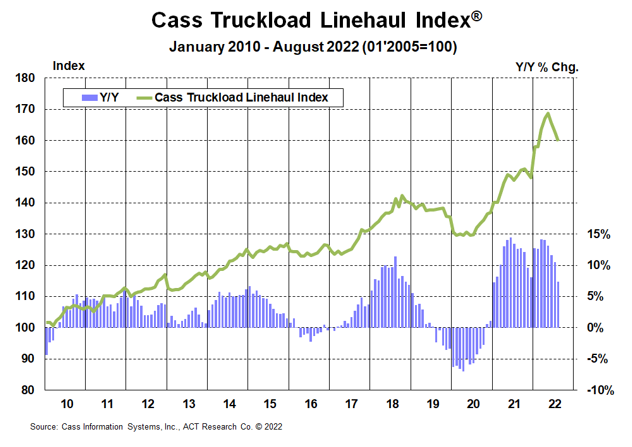
See the methodology for the Cass Truckload Linehaul Index.


Freight Expectations

Even with a summer volume uptick, freight markets are loose heading into peak season, largely due to the significant supply response which gained momentum this year.

During the active hurricane seasons of both 2020 and 2021 (June 1- November 30), the ACT Research composite of DAT spot rates, ex-fuel, rose 8% and 4%, respectively, into Labor Day. This year, spot rates fell about 6%, ex-fuel, amid the calmest hurricane season since 2013.

But there’s much more at work in the freight economy than the weather. The hurricane effect is considerable, and the season isn’t over, but we think the divergence between this year’s early September rate trend with the past two is mainly due to the looser market balance. The shipment rebound is, so far, not enough to outweigh the 4%-5% growth rates in the driver and Class 8 tractor populations presently. The story concludes in ACT Research’s monthly Freight Forecast.

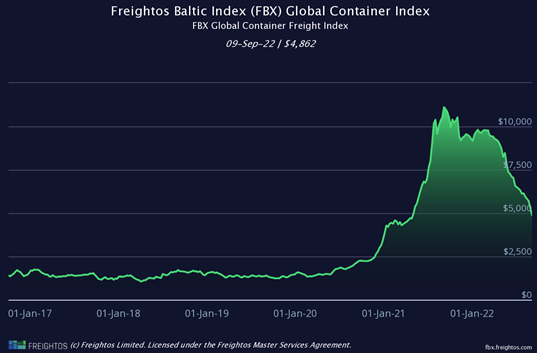
Moreover, the looser market balance we see in U.S. freight markets is consistent with the easing happening in global ocean spot markets, where rates were 56% below year-ago levels in early September (see chart). The broader effects of these cost savings for shippers will show up more in 2023, so should gradually become more helpful to the Fed’s fight against inflation and for resolving supply chain issues. One interesting takeaway from the IANA intermodal conference in Long Beach this week is that there’s still a whole lot of inefficient freight jamming warehouses and slowing rail service.


Freightos Baltic Index Sept 2022


Now that the pendulum is swinging, some crucial questions about the freight rate cycle have been raised: How bad? How long? And when will it turn? The ACT Research Freight Forecast report provides monthly, quarterly, and annual predictions for the truckload (TL), less-than-truckload (LTL), and intermodal markets through 2024, including capacity, volumes, and rates. The report provides monthly updates of forecasts for the shipments component of the Cass Freight Index and the Cass Truckload Linehaul Index®, as well as DAT spot rates by trailer type, including and excluding fuel surcharges.


Release date: We strive to release our indexes on the 12th of each month. When this falls on a Friday or weekend, our goal is to publish on the next business day.

Tim Denoyer head

About the Author: Tim Denoyer, ACT Research

Tim Denoyer joined ACT Research in 2017, after spending fifteen years in equity research focused primarily on the transportation, machinery, and automotive industries. Tim is a senior analyst leading ACT’s team transportation research effort, and the primary author of the ACT Freight Forecast, U.S. Rate and Volume Outlook. Research associate Carter Vieth, who joined ACT in early 2020 after graduating from Indiana University, also contributes to the report. This report provides supply chain professionals with better visibility on the future of pricing and volume in trucking, the core of the $1.06 trillion U.S. freight transportation industry, including truckload, less-than-truckload, and intermodal.

Tim also plays roles in ACT Research’s core Class 4-8 commercial vehicle data analysis and forecasting, in powertrain development, such as electrification analysis, and in used truck valuation and forecasting. Tim has supported or led numerous project-based market studies on behalf of clients in his four years with ACT Research on topics ranging from upcoming emissions and environmental regulations to alternative powertrain cost analyses to e-commerce and last-mile logistics to autonomous freight market sizing.

ACT’s freight research service leverages ACT’s expertise in the supply side economics of transportation and draws upon Tim’s background as an investment analyst, beginning at Prudential and Bear Stearns. Tim was a co-founder of Wolfe Research, one of the leading equity research firms in the investment industry. While with Wolfe, Tim was recognized in Institutional Investor’s survey of investors as a Rising Star analyst in both the machinery and auto sectors. His experience also includes responsibility for covering the industrial sector of the global equity markets, including with leading investment management company Balyasny Asset Management.

Disclaimer

The material contained herein is intended as general industry commentary. The Cass Freight Index, Cass Truckload Linehaul Index (“Indexes”), and other content are based upon information that we consider reliable, but Cass does not guarantee the accuracy, timeliness, reliability, continued availability or completeness of any information or underlying assumptions, and Cass shall have no liability for any errors, omissions or interruptions. Any data on past performance contained in the Indexes is no guarantee as to future performance. The Indexes and other content are not intended to predict actual results, and no assurances are given with respect thereto. Cass makes no warranty, express or implied. Opinions expressed herein as to the Indexes are those of Stifel and may differ from those of Cass Information Systems Inc. All opinions and estimates are given as of the date hereof and are subject to change.

Receive Index updates straight to your inbox