Cass Transportation Index Report June 2022

Get the most up-to-date data and insights into shipping volumes and the cost of freight. See how they change each month and understand the market forces behind them.

SubscribeDownload Historical Data Points (xls)

Late Cycle Soft Patch

  June 2022 Year-over-year change 2-year stacked change Month-to-month change Month-to-month change (SA)
Cass Freight Index - Shipments 1.203 -2.3% 23.9% -2.6% -4.1%
Cass Freight Index - Expenditures 4.665 25.0% 95.5% 8.8% 8.3%
Cass Inferred Freight Rates 3.878 27.9% NA 11.7% 12.9%
Truckload Linehaul Index 165.7 11.6% 27.8% -1.8% --


Cass Freight Index - Shipments

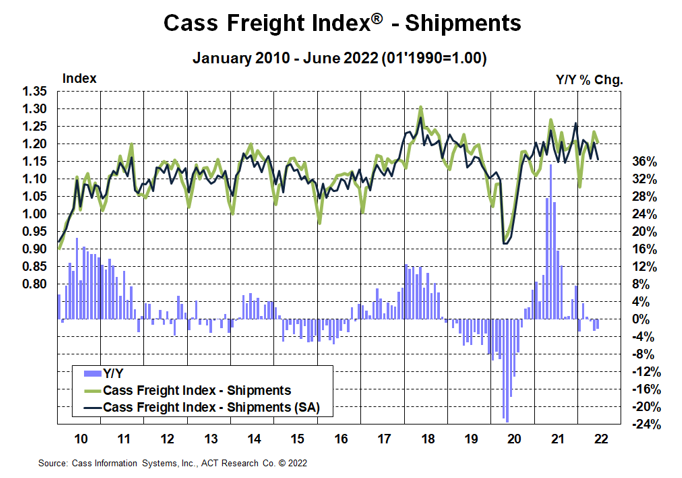
The shipments component of the Cass Freight Index® declined 2.3% on a y/y basis in June, similar to the 2.7% y/y decline in May. After the May result was slightly ahead of ACT Research’s estimate, the June result was slightly behind, but no big surprises.

  • On a seasonally adjusted (SA) basis, shipments fell 4.1% m/m in June, reversing the 4.0% increase in May.
  • Effects from China lockdowns were likely slight in June.
  • The shipments component has now been down 4 of 6 months this year on a y/y basis. That includes January, which was impacted significantly by Omicron, but there has not been much follow through on the rebound.
  • Inventory has shifted from a major tailwind for freight demand to more of a neutral factor currently, with potential to become a considerable headwind if goods demand continues to decline.

Normal seasonality from this index level would imply shipments down 1% y/y in Q3 and down 5% y/y in Q4, as the current soft patch is becoming increasingly clear in the data. 


Shipments June 2022


See the methodology for the Cass Freight Index.


Cass Freight Index - Expenditures

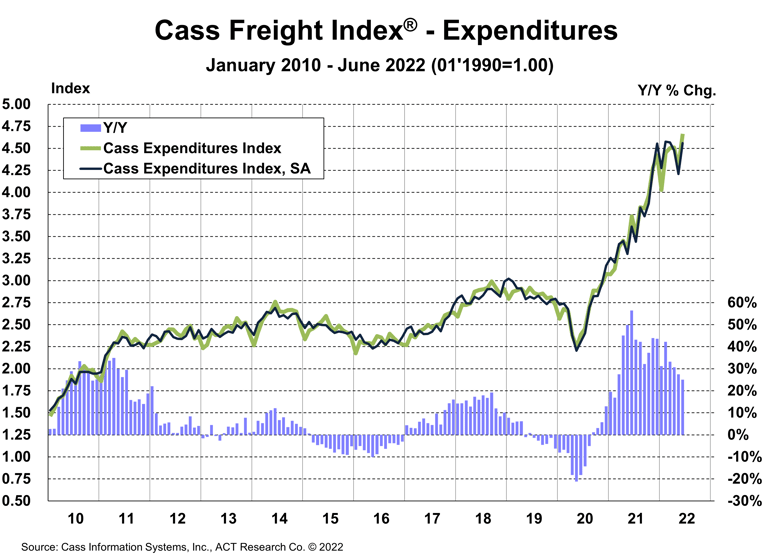
The expenditures component of the Cass Freight Index, which measures the total amount spent on freight, rose 8.8% m/m in June to a new record, with shipments down 2.6% and rates up 11.7%. The m/m noise on rates is largely mix, and reversed a 9.8% decline last month, and just means there was more truckload in the mix in June and more less-than-truckload (LTL) in May.

  • The Expenditures portion of the Cass Freight Index was still 25% higher than year-ago levels in June, continuing to decelerate from 28% in May.
  • On a seasonally adjusted basis, expenditures rose 8.3% m/m in June, with shipments down 4.1% m/m and rates up 12.9%, largely a reversal of May.

We estimate roughly 10 percentage points of the y/y increase are currently due to fuel prices alone. As a reminder, this index includes changes in fuel, modal mix, intramodal mix (which affects length of haul), and accessorial charges.

Simply using normal seasonality from here, this index will still be rising y/y through 2022, ending with a 2% y/y increase in December, against a 32% y/y increase in 1H’22.


Cass Expenditures June 2022


Inferred Freight Rates

Cass Inferred Freight Rates, which measure the change in cost per shipment, still rose 28% y/y in June, decelerated from 31% y/y increase in May. Month to month, they rose 11.7% (12.9% SA), more than reversing the 9.8% decline in May (-9.5% SA).

The sequential increase was largely due to modal mix, as truckload moves (a higher cost per shipment) increased compared to LTL (lower cost per shipment), reversing the increase in LTL mix in May. Fuel prices also pushed rates up in June. And while underlying truckload rates started to pull back in June (see the Cass Truckload Linehaul Index, below), LTL rates continued to rise m/m.

The May decline in cost per shipment was also largely due to mix, as noted last month, and June freight rates were just 0.8% above April. We still see this as a leveling off of industry rates, with ongoing upward pressure from fuel even as the market balance has loosened this year and should begin to provide modest relief. This is subject in no small part to diesel prices, which have begun to drop, now down 24c over the past three weeks to a recent $5.57 per gallon according to the U.S. Energy Information Administration (EIA). The price of diesel remains well above where our simple regression with crude would suggest, reflecting a considerable war premium.

So, the familiar refrain is true, shippers aren’t feeling the savings from declining spot rates. Yet. At this point, it is increasingly oil prices in the way, but such relief is increasingly likely, which is welcome news for the broader inflation picture.


Inferred Rates June 2022


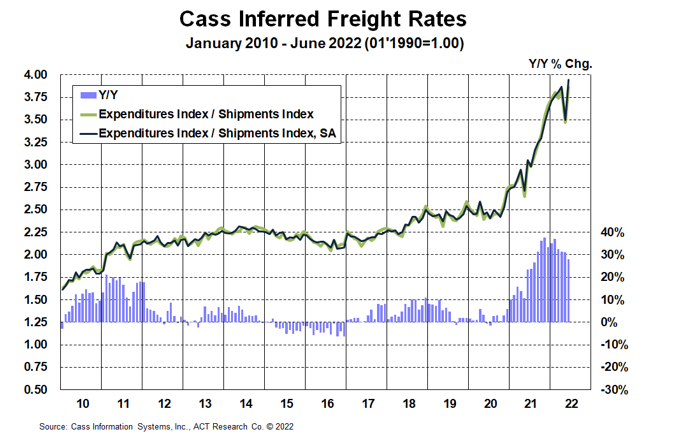
Cass Inferred Freight Rates are a simple calculation of the Cass Freight Index data, expenditures divided by shipments, producing a data set that explains the overall movement in cost per shipment. The data set is diversified among all modes, with truckload representing more than half of the dollars, followed by LTL, rail, parcel, and so on.


Download the data

Truckload Linehaul Index

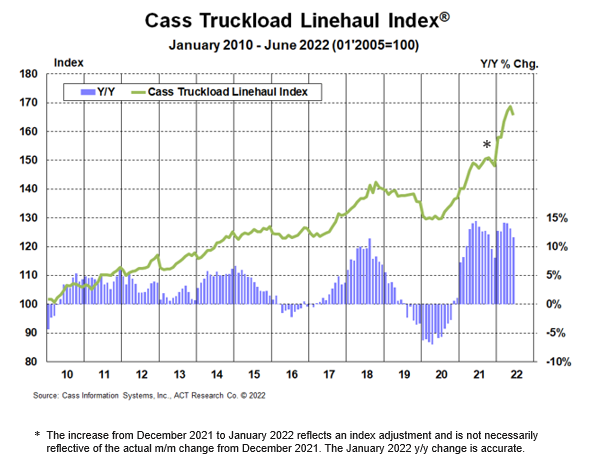
The Cass Truckload Linehaul Index® , which measures market fluctuations in per-mile truckload linehaul rates, independent of additional cost components such as fuel and accessorials, rose 11.6% y/y in June to 165.7 after rising 13.2% y/y in May.

  • After an extraordinary truckload rate cycle, the market balance has shifted, with capacity now growing briskly and demand falling, which will limit further upside in the Cass Truckload Linehaul Index and likely press it lower in the coming months.
  • Similar to what has occurred in the spot market, the surge in fuel costs to shippers, which are excluded from this index, will also likely act as a brake on linehaul rates.


Cass Truckload Linehaul Index June 2022


See the methodology for the Cass Truckload Linehaul Index.


Freight Expectations

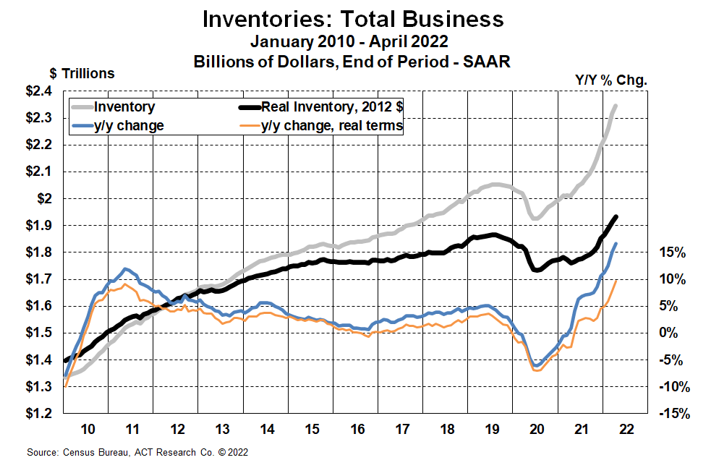
You may find a chart of inventories, one of the most lagged (toughest to calculate) monthly economic data series (with the latest numbers as of April), odd in the section about the outlook. But even from a few months ago, inventories provide key information about the future of the cycle. And we can say clearly that the current inventory levels do not bode well for freight demand.

  • Total U.S. inventories were up 17% y/y in nominal terms in April to $2.35 trillion, with retail inventories up 20% y/y ex-autos.
  • In real terms, total inventories were up 10% y/y in April, a record growth rate in this data set going back to the early 1990s. Inventories seemed to rise further in May, based on major retailers’ reports.
  • The April retail inventory/sales ratio, ex-autos, rose to 1.15 from a low of 1.05 last September, and is quickly closing in on its 10-year average of 1.21. The chart below includes autos.
  • Inventory building may have slowed some, but continued upward since, and will soon be above average, as the cost of capital is rising.


Inventories June 2022


Now that the pendulum has begun to swing, “how bad?” and “how long?” have become some of the most crucial questions. The ACT Freight Forecast report provides monthly, quarterly, and annual predictions for the TL, LTL, and intermodal markets, including capacity, volumes, and rates. The report provides monthly updates of forecasts for the shipments component of the Cass Freight Index® and the Cass Truckload Linehaul Index® through 2024, as well as DAT spot rates by trailer type, including and excluding fuel surcharges.


Release date: We strive to release our indexes on the 12th of each month. When this falls on a Friday or weekend, our goal is to publish on the next business day.

Tim Denoyer head

About the Author: Tim Denoyer, ACT Research

Tim Denoyer joined ACT Research in 2017, after spending fifteen years in equity research focused primarily on the transportation, machinery, and automotive industries. Tim is a senior analyst leading ACT’s team transportation research effort, and the primary author of the ACT Freight Forecast, U.S. Rate and Volume Outlook. Research associate Carter Vieth, who joined ACT in early 2020 after graduating from Indiana University, also contributes to the report. This report provides supply chain professionals with better visibility on the future of pricing and volume in trucking, the core of the $1.06 trillion U.S. freight transportation industry, including truckload, less-than-truckload, and intermodal.

Tim also plays roles in ACT Research’s core Class 4-8 commercial vehicle data analysis and forecasting, in powertrain development, such as electrification analysis, and in used truck valuation and forecasting. Tim has supported or led numerous project-based market studies on behalf of clients in his four years with ACT Research on topics ranging from upcoming emissions and environmental regulations to alternative powertrain cost analyses to e-commerce and last-mile logistics to autonomous freight market sizing.

ACT’s freight research service leverages ACT’s expertise in the supply side economics of transportation and draws upon Tim’s background as an investment analyst, beginning at Prudential and Bear Stearns. Tim was a co-founder of Wolfe Research, one of the leading equity research firms in the investment industry. While with Wolfe, Tim was recognized in Institutional Investor’s survey of investors as a Rising Star analyst in both the machinery and auto sectors. His experience also includes responsibility for covering the industrial sector of the global equity markets, including with leading investment management company Balyasny Asset Management.

Disclaimer

The material contained herein is intended as general industry commentary. The Cass Freight Index, Cass Truckload Linehaul Index (“Indexes”), and other content are based upon information that we consider reliable, but Cass does not guarantee the accuracy, timeliness, reliability, continued availability or completeness of any information or underlying assumptions, and Cass shall have no liability for any errors, omissions or interruptions. Any data on past performance contained in the Indexes is no guarantee as to future performance. The Indexes and other content are not intended to predict actual results, and no assurances are given with respect thereto. Cass makes no warranty, express or implied. Opinions expressed herein as to the Indexes are those of Stifel and may differ from those of Cass Information Systems Inc. All opinions and estimates are given as of the date hereof and are subject to change.

Receive Index updates straight to your inbox