The shipments component of the Cass Freight Index® grew 15.6% y/y in July, decelerated from the 26.8% y/y increase in June.
The short-term skid is consistent with recent slowdowns in rail and LTL volumes, much of which is attributable to equipment and driver capacity constraints. Shipment volumes remain limited to no small extent by the capacity of the freight network, as the 121 containerships anchored off North American ports on August 10th attest to.
Fading federal stimulus was also likely a contributor, though the elevated U.S. savings rate and tight inventories mitigate this risk.
The ACT Freight Forecast from ACT Research report forecasts the Cass Truckload Linehaul Index and the Cass shipments index through 2023.
Chart: Cass Shipments Index, January 2009 – July 2021 (01’1990=1.00)
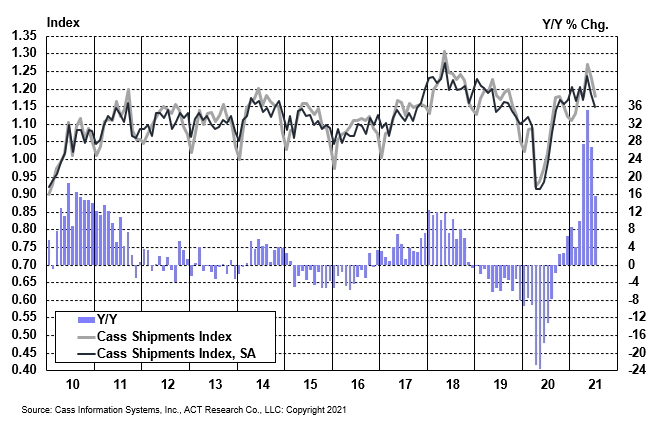
See the methodology for the Cass Freight Index.
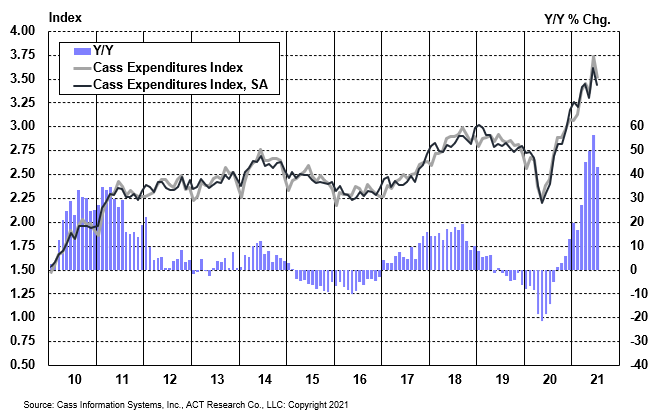
The expenditures component of the Cass Freight Index measures the total amount spent on freight. This index slowed from its fastest-ever increase on a y/y basis. After rising 56.4% y/y in June, the index slowed to 43.1% y/y growth in July.
Tougher comparisons in the coming months will naturally slow these y/y increases further, but extraordinary growth rates will continue in the near-term, driven by increases in both shipment volumes and freight rates.
Chart: Cass Expenditures Index, January 2009 – July 2021 (01’1990=1.00)
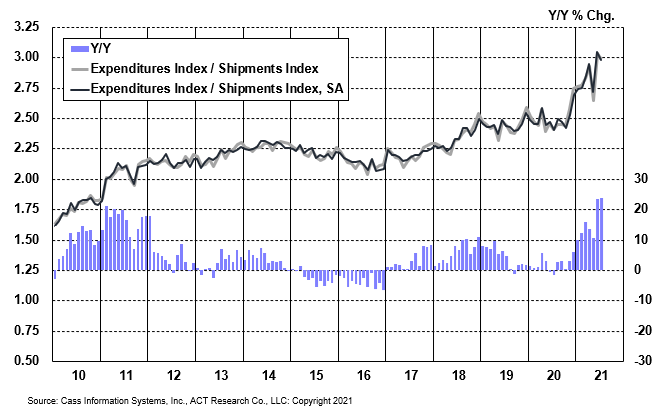
A simple calculation of the Cass Freight Index data (expenditures divided by shipments) produces a data set of inferred freight rates that explains the overall movement in rates.
Similar to two months ago, July's data set had a higher-than-normal percentage of smaller, lower cost LTL. This mix shift pressed total embedded rates lower again in July, so the downtick is more likely due to mix than a change in the upward rate trend.
Outside of mix shifts impacting the m/m data patterns, this data series shows broad and material increases in freight rates across modes. The data set is diversified among all modes, with truckload representing more than half of the dollars, followed by rail, LTL, parcel, and so on.
Chart: Cass Inferred Freight Rates, January 2009 – July 2021 (01’1990=1.00)
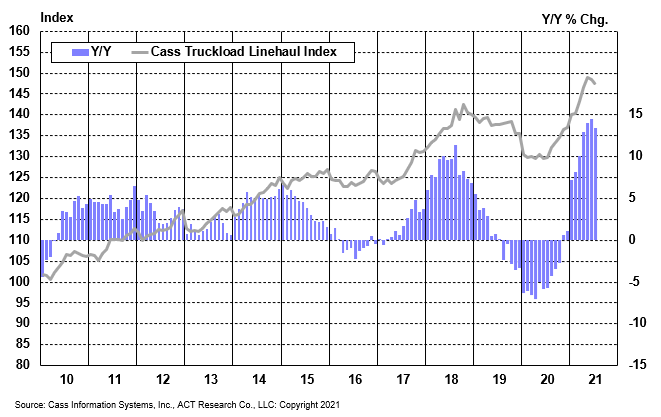
The Cass Truckload Linehaul Index® value of 147.2 in July fell 0.8% from 148.4 in June and decelerated to a 13.4% y/y increase from 14.5% in June. This was the second straight decline after eleven straight increases, but we would caution shippers not to get too excited and carriers not to worry too much, as this appears to be due to mix rather than a trend change.
The length of haul rose considerably again this month, and rates tend to fall on a per mile basis as mileage lengthens, so this intramodal mix shift pressed down on the index a little. This shift in freight patterns is more symptomatic of the rail network stretched to capacity, which is resulting in more transloading of longer-haul import shipments from the West Coast ports to the Midwest via truck.
By contrast, the public truckload carriers saw length of haul continue to decline in their recently reported Q2 results, and their rates, in revenue per mile, net fuel, showed a 17.6% y/y increase. From our perspective, the mix-neutral truckload market rate increase was somewhere between this and the 13.6% y/y increase in the Cass Truckload Linehaul Index in Q2.
The still-tight supply/demand balance will continue to buoy the trend of the Cass Truckload Linehaul Index, and when rail network fluidity recovers and truckload length of haul reverts, it will also put mix-related upward pressure on this index.
But although truck, trailer, and chassis production are still limited by parts and labor shortages, capacity is beginning to return as drivers respond to higher pay and parts constraints begin to ease. These will gradually change the trajectory of truckload rates.
Chart: Cass Truckload Linehaul Index®, January 2009 – July 2021 (01’1990=1.00)
See the methodology for the Cass Truckload Linehaul Index.
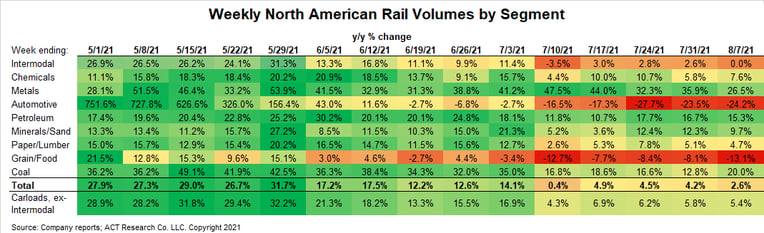
Class I railroad trends had a rough June and July, lagging seasonal trends due in part to worsening chassis shortages. ACT Research chassis production forecasts have been cut sharply as a specific tariff issue has sharply limited new chassis availability. Auto and truck production have been hit hard again by chip shortages, which do not seem likely to be fully resolved for quite some time.
Normal seasonality would suggest high-single-digit growth in rail volumes in Q3, down from the 23% y/y increase in Q2, but momentum slowed over the past two months as network fluidity has suffered and chip shortages have worsened. If these issues persist, there is a risk of rail volumes slipping to y/y declines.
Though the TL and LTL sectors aren’t subject to quite the same capacity constraints, this suggests a bit slower near-term freight volume outlook. With 121 containerships anchored off North American ports as of August 10th, the outlook for this peak season is clearly strong, but supply chains remain stretched.
Freight demand fundamentals remain strong, based on a cash-flush U.S. consumer balance sheet, tight inventories, and an industrial sector struggling to grow into record orders with fiscal stimulus likely on the way.
But the dynamics of tight supply and exceptionally strong demand which have characterized the past year or so will not last indefinitely, and several of the indicators we monitor are auguring new trajectories.
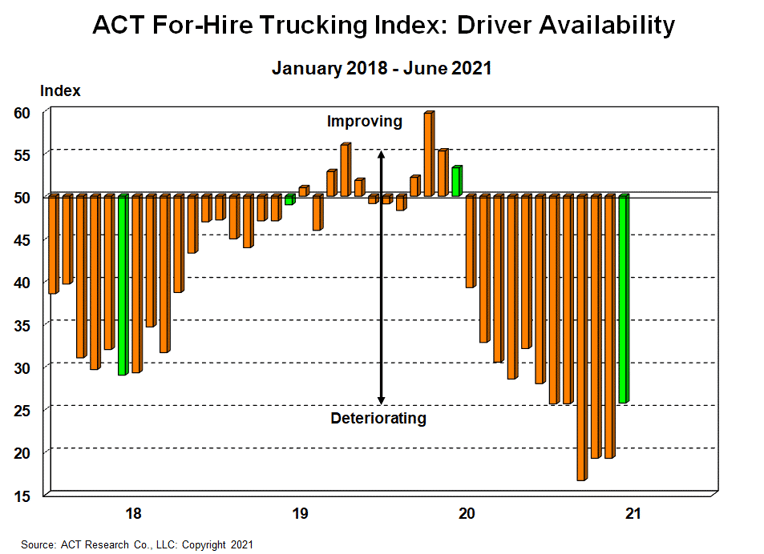
In particular, though the truck driver market remains very tight and the recent early signs of momentum in hiring could be interrupted by new COVID-19 variants, there are increasing signs that drivers are starting to come back in greater numbers. The data from ACT Research’s monthly for-hire carrier survey suggest that although the market remains tight, the trend is changing.
The ACT Freight Forecast report provides data-driven predictions for the unique cycles in freight-hauling capacity, demand, and rates in each of the truckload, LTL, and intermodal markets over a three-year planning horizon. While taking seasonality into account, these econometric forecasts consider several crucial variables, including freight market conditions, macroeconomic conditions, inventory levels and supply side factors.

