Shipment volumes dropped 9.4% in January vs 2019 levels (Chart 1), as the index posted its lowest absolute reading in roughly three years. It was also the steepest y/y decline since 2009. This follows a sluggish end to 2019, where many blamed last month’s weakness on timing of the holidays. There could have been a residual impact post-New Years, but with the negative y/y and sequential decline, and the deceleration in the y/y growth rate, we don’t see much good news in this volume number.
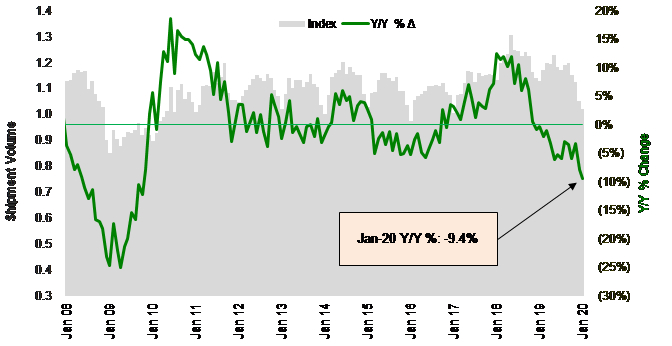
Source: Cass Information Systems and Stifel Research
To activate the data download feature, double click within the chart area and then select the download icon.
Click here to receive a monthly alert when new data is released.
Even before the coronavirus issues have any impact on the U.S. transportation market, the freight market is weak, partially due to elevated inventories (Chart 2) (although the inventory situation has at least stabilized and is likely improving). On 4Q19 earnings calls, we heard manufacturers and distributors say inventories look like they’re returning to normal levels, but the optimism for 2020 was only modest. Orders are still soft, and the most positive commentary was around the consumer and residential construction.
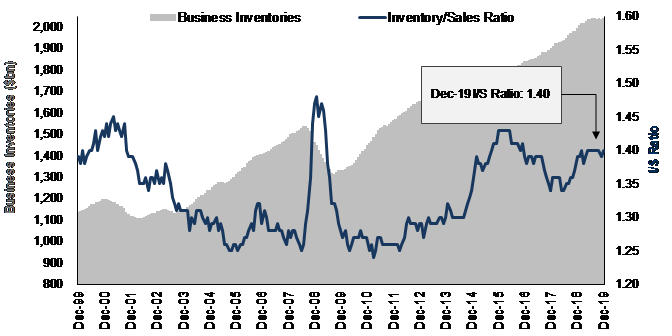
Source: U.S. Census Bureau and Stifel Research
Depending on the severity of the Chinese plant shutdowns and trade volumes, we may see inventories dip significantly over the next couple of months – potentially requiring a period of restocking. So, when exports do begin to grow again, watch the airfreight market (Chart 3) for the first signs of the demand rebound, as retailers and manufacturers need to play catch-up. The airfreight market has been hurting for some time, but we expect a least a short period of large yield spikes for cargo capacity, especially with belly space limited.
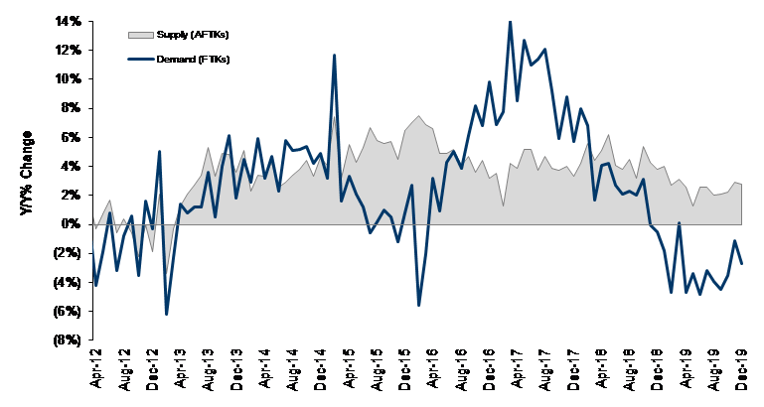
Source: IATA data through Dec. 2019 and Stifel research
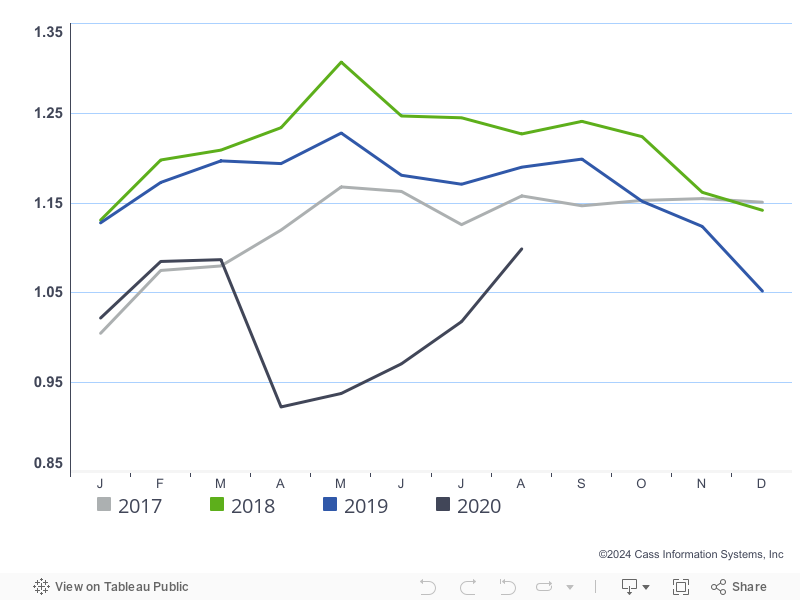
The North American rail data (Chart 4) is looking a little better in January, as the comps improved, but the Cass Freight Index is much more focused on truck than rail. Plus, near-term, there may be a step back down due to the coronavirus impact, as inbound ships and containers are few and far between right now.
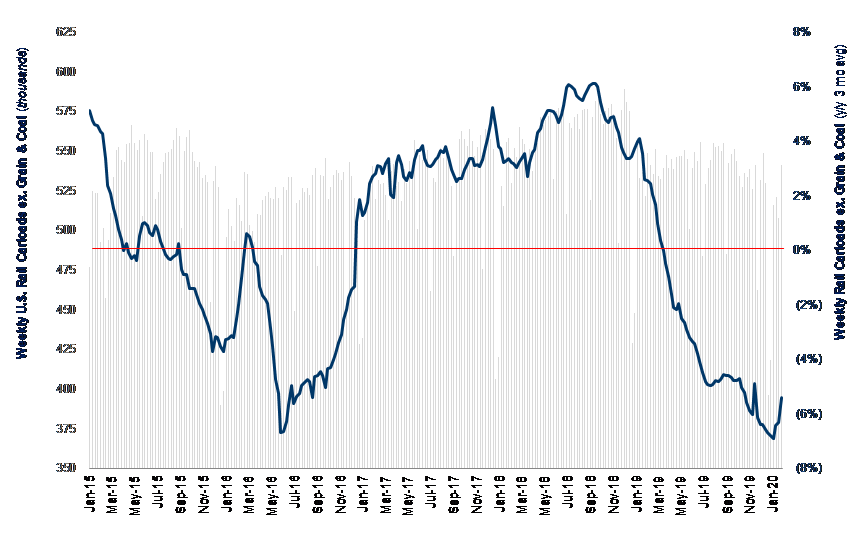
Note - Carloads are originations through the week of 1/25/2020
Source: Association of American Railroads and Stifel research
On the plus side, going into 2020, the sentiment index for consumer confidence remains high (Chart 5). This is why the freight (and industrial) data has not translated into worse news for the broader economy yet. If this trend continues, it will provide support for the economy and likely guarantee the President a second term in office.
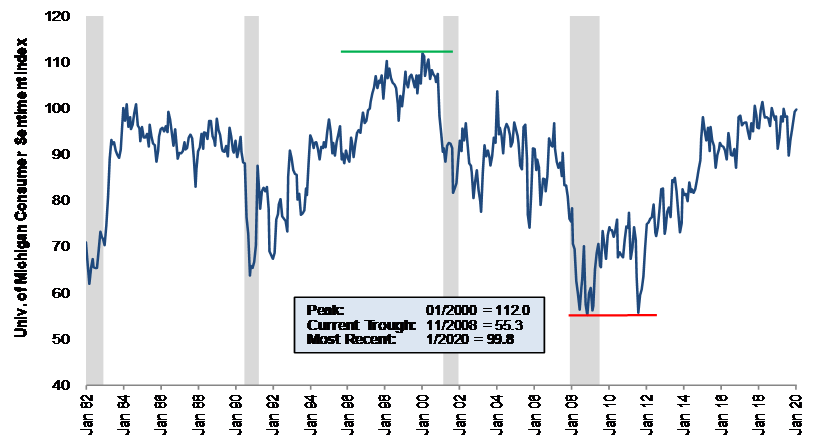
Source: University of Michigan and Stifel research

Cass Freight Index - Expenditures
Probably not surprisingly, like shipment volumes, freight expenditures also fell, down 8.0% y/y (Chart 6). But the fall-off was not as severe, as industry pricing was generally still a little higher than year-ago levels. The drop sequentially (from -6.2% y/y in December) was greater than the sequential volume decline, as contract pricing remains under pressure during the current bid cycle. But since the Cass Freight Index is a mix of freight modes (but >50% truckload), overall expenditures fell less than volumes due to better pricing power still exhibited by the rail, parcel, and LTL sectors. We expect transport pricing growth to moderate in 2020 but remain inflationary. And, as usual, our best estimate on fuel (a significant part of overall freight costs) is that it stays roughly flat from here.
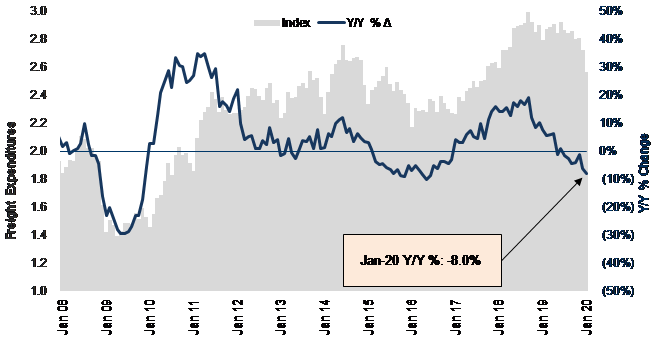
Source: Cass Information Systems, Inc. and Stifel research
To activate the data download feature, double click within the chart area and then select the download icon.
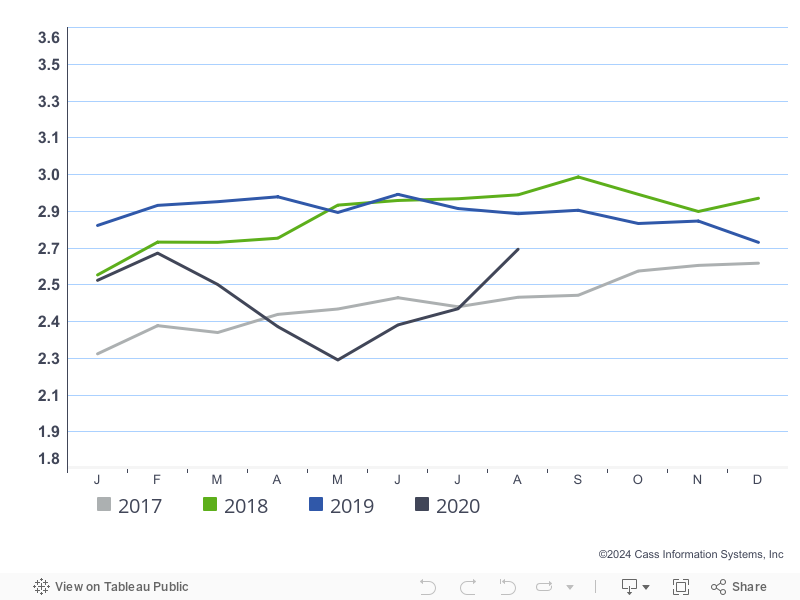
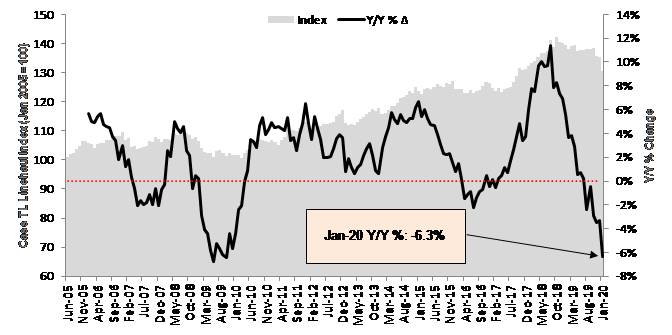
The Cass Truckload Linehaul Index (Chart 7), measuring per-mile linehaul rates, takes a look at the largest (and most fragmented) market in the domestic transportation landscape, and it showed a y/y decline of 6.3% in January (a big step-down from the -3.3% in December), as capacity loosened after a tight holiday shipping period.
The focus in the coming quarters will be on industry supply (how many trucks do we have for the amount of freight that needs to be hauled?) and how that should play out in the first half of 2020 with some regulatory changes, or, maybe more importantly, with rising pressure on insurance costs (to unreasonably high levels for both large and small fleets). At the recent Stifel Transportation & Logistics Conference, the common outlook from industry executives was that supply and demand should find equilibrium around mid-year, at which point spot rates should resume their premium to contract rates and give contract rates room to rise again in 2021.
Source: Cass Information Systems, Inc. and Stifel research

To activate the data download feature, double click within the chart area and then select the download icon.
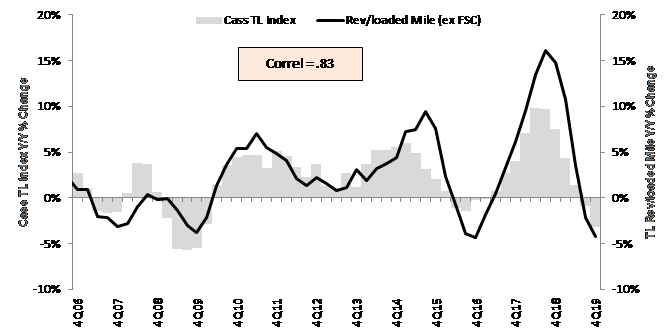
As we’ve shown (Chart 8), the Cass Truckload Linehaul Index has a strong correlation to the quarterly yield metrics reported by the publicly traded TL carriers. The fact that January is off to a poor start signals another disappointing quarter ahead for both pricing and volumes at the publicly traded truckload companies.
Source: Cass Information Systems, public carrier data and Stifel research
Note: All historical truckload and intermodal data was restated in November 2019, with an extremely high correlation to the previous data.
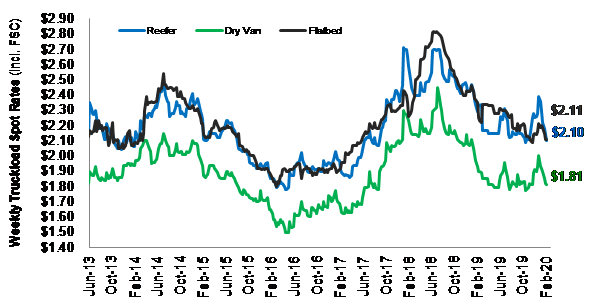
There was hope that the increase in spot rates (Chart 9) seen in December (but not obvious in the Cass Index for Expenditures, because most freight is moved in the contract market, not the spot market) would lead to better rates next year. Maybe they eventually will, but the spot rates fell again in January, as we said they would in the last report.
Source: DAT Solutions and Stifel research
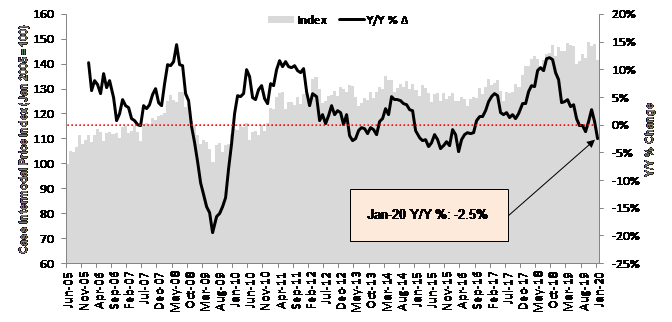
The Cass Intermodal Price Index (Chart 10), measuring total per-mile costs, looks at the smaller intermodal market and finally showed a crack, falling 2.5% y/y in January (after 0.7% y/y growth in December and 2.8% y/y growth in November). Intermodal volumes are about to face much easier comps this year, but the risk will be the import/export activity through the West Coast ports. Again, we’re watching trans-Pac ocean volumes closely. We believe intermodal rates should strengthen again when TL rates begin improving, as truckload pricing continues to weigh on both intermodal pricing and volumes. Most intermodal providers have done a good job holding the line on price, and improved rail service should justify higher rates, but only when trucking rates move up.
Source: Cass Information Systems, Inc. and Stifel research

To activate the data download feature, double click within the chart area and then select the download icon.
Note: All historical truckload and intermodal data was restated in November 2019, with an extremely high correlation to the previous data.