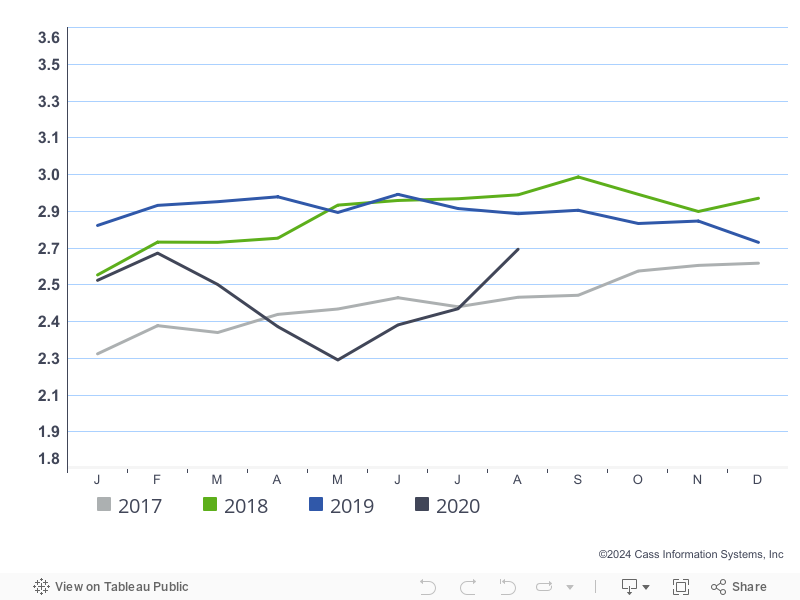
Shipment volumes dropped 7.5% vs February 2019 levels (Chart 1), but the index improved sequentially from a low point. January may have been the bottom, but the coronavirus concerns leave open the possibility for a “double dip” or at least a delay in improvements. Of concern, the Port of Los Angeles just reported a 23% y/y drop in imports for February.
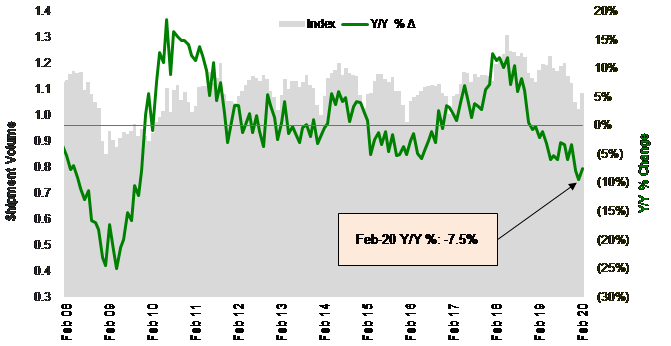
Source: Cass Information Systems and Stifel research
To activate the data download feature, double click within the chart area and then select the download icon.
Click here to receive a monthly alert when new data is released.
We spoke about consumer confidence last month (Chart 2), which we believe is seriously at risk, given the media blitz, school closings, event cancellations, corporate travel bans, and the fear dominos falling around the coronavirus. So, while freight (and industrial) data has not yet signaled bad news for the broader economy, it may be coming.
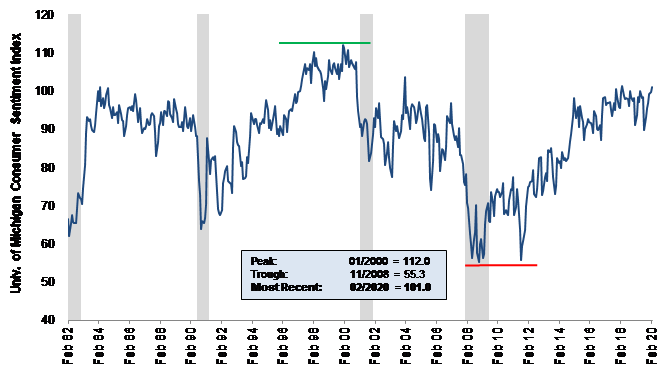
Source: University of Michigan and Stifel research
Even before the coronavirus issues (now declared a pandemic by the World Health Organization) has had any impact on the U.S. transportation market, the freight market started the year weak, partially due to elevated inventories (Chart 3), although the inventory situation we believe is rapidly improving and may end up requiring a restock before too long.
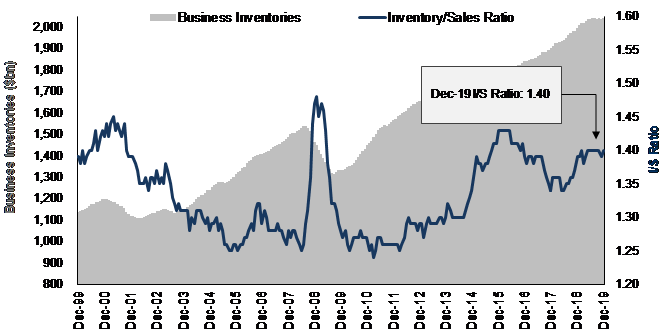
Source: U.S. Census Bureau and Stifel research
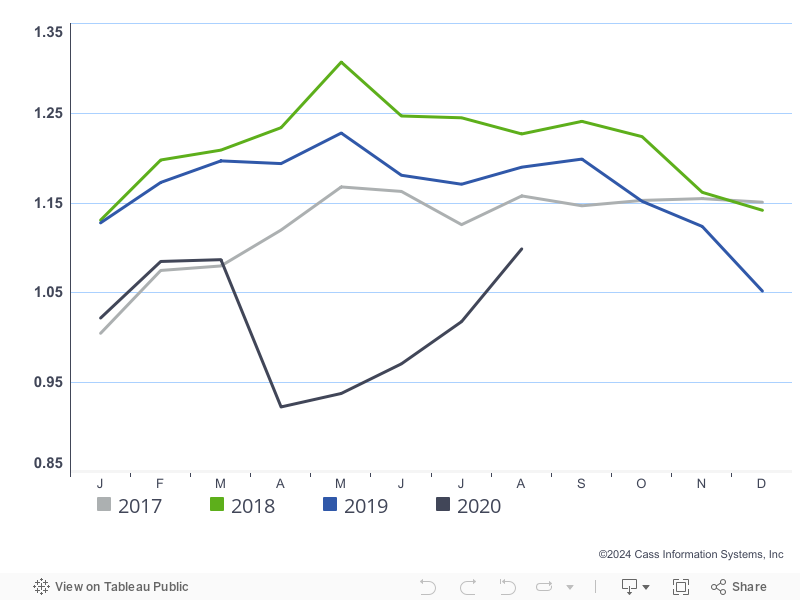
When exports do bounce again, we’re looking to the airfreight market (Chart 4) for the first signs of the demand rebound, as retailers and manufacturers need to play catch-up. The airfreight market has been hurting for some time, but we expect at least a short period of large yield spikes for cargo capacity, especially with belly space limited. Today, though, we’re hearing airfreight yields spiking due more to the lack of available capacity rather than any surge in demand. The demand surge requires production levels that have not yet been reached in China and then inventory levels that may not have been reached yet in the U.S. (and elsewhere).
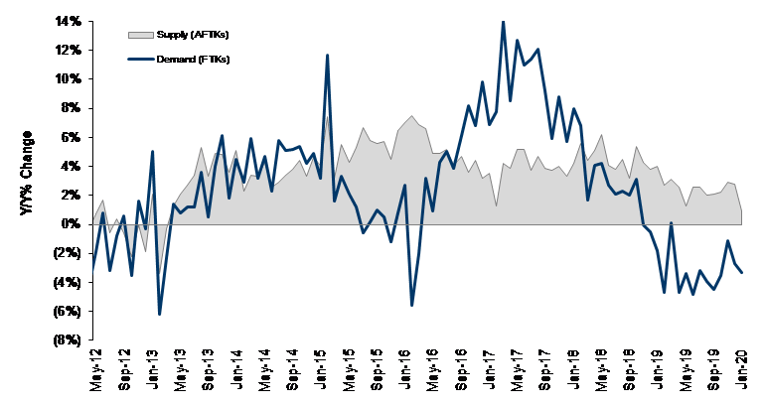
Source: IATA data through Jan. 2020 and Stifel research
Railroad volume data (Chart 5) tracked similar to the Cass Shipments Index in that numbers are still down y/y, but up off the January lows. Of course, the Cass Freight Index is much more focused on truck than rail, which is why we show the carloadings below without coal and grain shipments (this tends to track more closely to truck activity). While in the near term there should be negative impact due to the coronavirus, we would expect a rebound in weekly intermodal volumes to signal a return to normal economic activity.
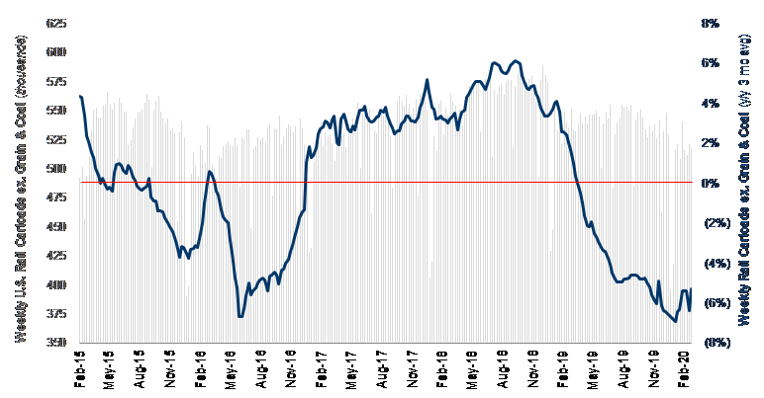
Note - Carloads are originations through the week of 2/29/2020
Source: Association of American Railroads and Stifel research

Cass Freight Index - Expenditures
Back to the Cass Indexes, freight expenditures, like shipment volumes, also fell in February, down 6.8% y/y (Chart 6). The gap between volume and spending comps is closing, as pricing has been adjusted lower in the truckload market. We expect transport pricing growth to stay soft near-term, but we’re watching capacity exits and a potential re-stocking event to drive rates higher again at some point this year.
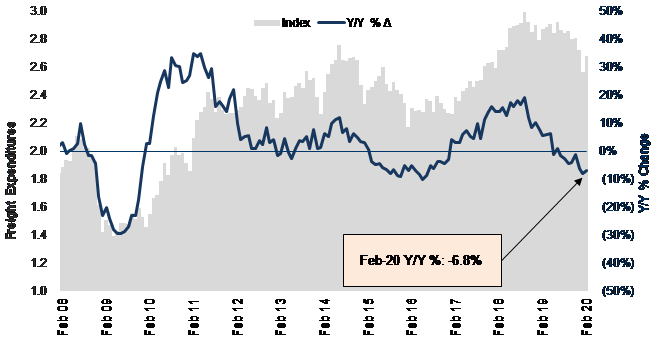
Source: Cass Information Systems, Inc. and Stifel research
To activate the data download feature, double click within the chart area and then select the download icon.
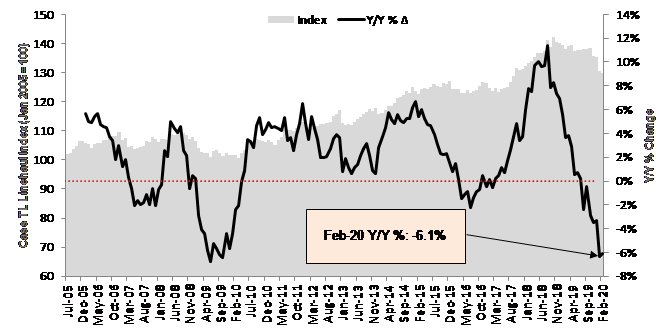
The Truckload (TL) Linehaul Index (Chart 7), measuring per-mile linehaul rates, takes a look at the largest (and most fragmented) market in the domestic transportation landscape, and it showed a y/y decline of 6.1% in February (a little better than the -6.3% in January), as rates remain under pressure in the seasonally soft first quarter.
Most of the talk in the truckload industry has been around overall supply (how many trucks do we have for the amount of freight that needs to be hauled?) and how that should play out in the first half of 2020 with some regulatory changes and rising pressure on insurance costs. At the Stifel Transportation & Logistics Conference last month, the common outlook from industry executives was that supply and demand should find equilibrium around mid-year, at which point spot rates should resume their premium to contract rates and give contract rates room to rise again in 2021. But this was assuming decent volume, before the coronavirus was seriously discussed and potentially derailing demand for a period of time. We expect capacity to continue to come out and are watching demand levels to drive the timing of higher rates.
Source: Cass Information Systems, Inc. and Stifel research

To activate the data download feature, double click within the chart area and then select the download icon.
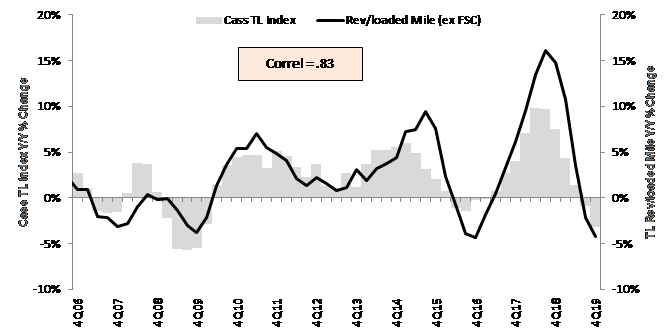
As we’ve shown (Chart 8) the Cass Truckload Linehaul Index has a strong correlation to the quarterly yield metrics reported by the publicly traded TL carriers. The fact that YTD pricing through February is so soft looks like another weak 1Q ahead for publicly traded truckload companies.
Source: Cass Information Systems, public carrier data, and Stifel research
Note: All historical truckload and intermodal data was restated in November 2019, with an extremely high correlation to the previous data.
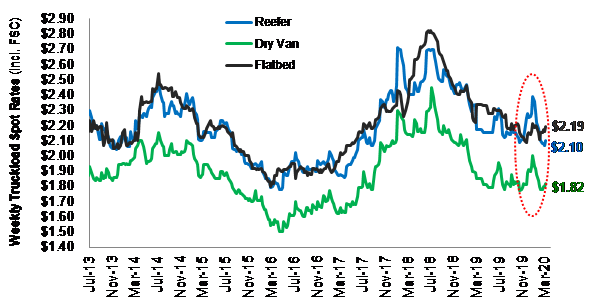
Spot rates (Chart 9) have just started to pick up again here in early March, but that is seasonal and not indicative of where contract rates will go near-term. A more severe spike will indicate to us that capacity shortages are again emerging.
Source: DAT Solutions and Stifel research
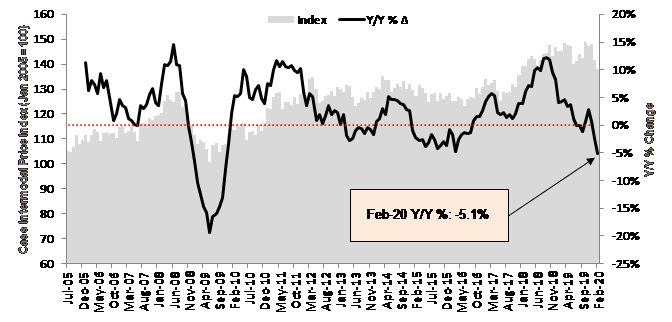
The Cass Intermodal Price Index (Chart 10), measuring total per-mile costs, looks at the smaller intermodal market and is showing some pain, falling 5.1% y/y in February (after dropping 2.5% y/y in January). Intermodal volumes are still well below year-ago levels, and the risk is that West Coast imports will slow significantly, pushing out the expected recovery. But we believe intermodal rates should strengthen again when TL rates begin improving, as truckload pricing continues to weigh on both intermodal pricing and volumes. Most intermodal providers and rails have improved service levels, but they’ll need more volume and a better truckload market to see the price index turn around.
Source: Cass Information Systems, Inc. and Stifel research

To activate the data download feature, double click within the chart area and then select the download icon.
Note: All historical truckload and intermodal data was restated in November 2019, with an extremely high correlation to the previous data.